- Jun 16, 2023
- 3 min read
Updated: Oct 4, 2023
Looking at objects in geospatial data taken from one angle or by only one particular sensor can be challenging, especially when handling data sets of unfamiliar regions or scenes. The Flai web application simplifies the visual interpretation of data by supporting multiple possibilities for combining different types of data sets.
Point cloud mini map
Example of the location mini map, where extension of the dataset, current location and viewer direction are visible.
When looking at any georeferenced (and uploaded by selecting the correct EPSG code) point cloud in our 3D viewer, it is convenient to include its location on a topographical world map.
![]()
If you want to enable map view, click on the middle of three icons located in the bottom right corner of the point cloud viewer. This will open a resizable map in the top left corner of the viewer. The map showcases the current location, the azimuth of the observer and the bounding extent of your point cloud. This map will also include locations of all your points of interest added to the current dataset. With them, you can easily match objects in the point cloud and on the map.
Multi view functionality
We also provide a functionality to show two or more location-synchronized datasets of different types in the same browser window. To create such a view you must first create a new project (select Projects in the main left menu) and attach existing or newly uploaded datasets to it. This can be done by selecting one of the options marked in green in the below figure.
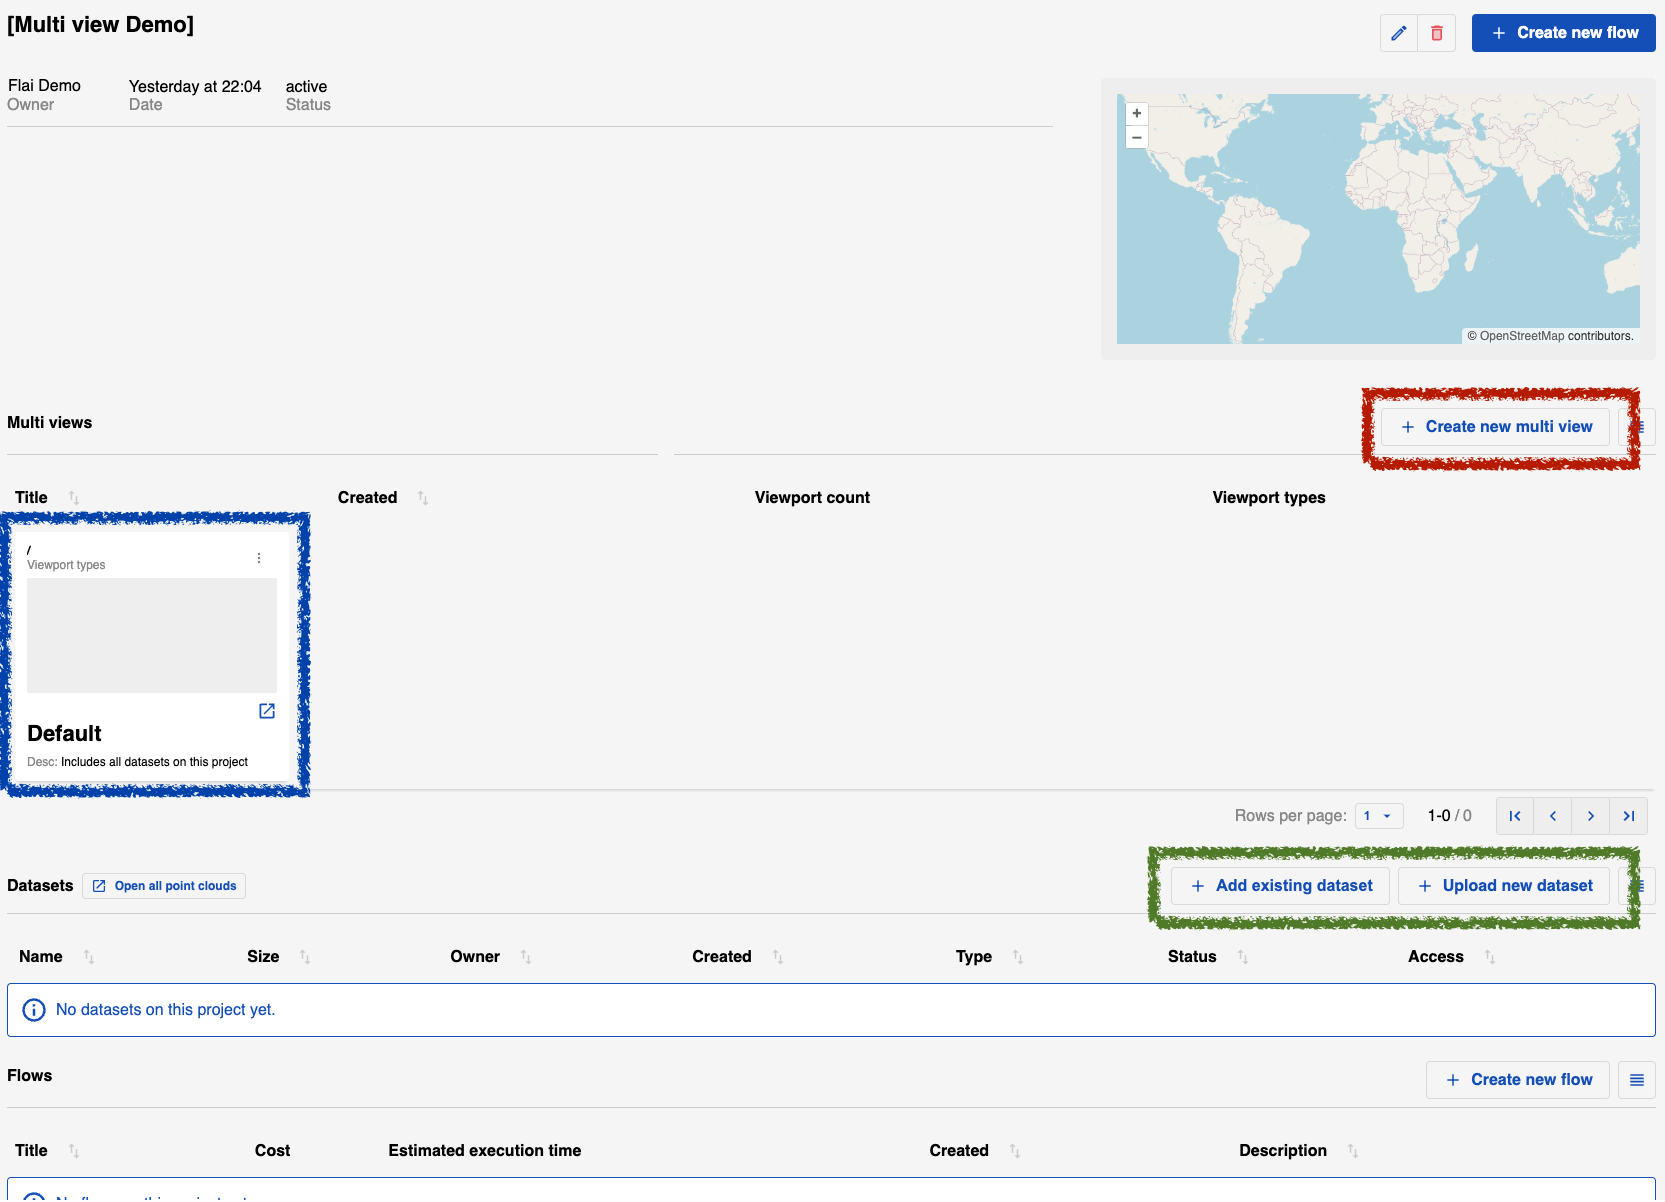
Empty project page with pre-attached Default multiview, but without any datasets or processing flows. Options marked in green are used to attach datasets to this project and later simultaneously opened by selecting the Default multi view marked in blue. More complex multi views can be configured by option marked in red. The extent of the attached datasets is also shown in the mini map after they are added to a project.
After attaching all relevant datasets that should be visualized, the easiest way to show all attached datasets is to use the already existing Deafult multi view. This will open a new window with one view for all attached point clouds and a second view for all raster and vector datasets combined. If one of them is not in your project, only one view will be shown.
Flai also supports the creation of more complex custom multi views. You can create them by starting multi view visualization creation by clicking on the red option in the above figure. This will open a new window that allows you to specify as many view ports as you want. Available are two options: a 3D view port that can hold point cloud datasets and a 2D view port that can hold raster and vector datasets. Each view port can hold one or more datasets. Example creation, window arrangement and scaling are showcased in the following video.
Multi view configuration example.
After placing your view ports, you have to add at least one dataset to every one of them. This can be done by a dataset drop-down menu below the view port name. Select a dataset in the drop down menu (textual search is enabled) and click on it to be added to the view port. After adding, the dataset can also be removed from the visualization. The same dataset can be added to more than one view port if you want to visualize its multiple features at the same time without any option changes, which would be required in a single dataset view.
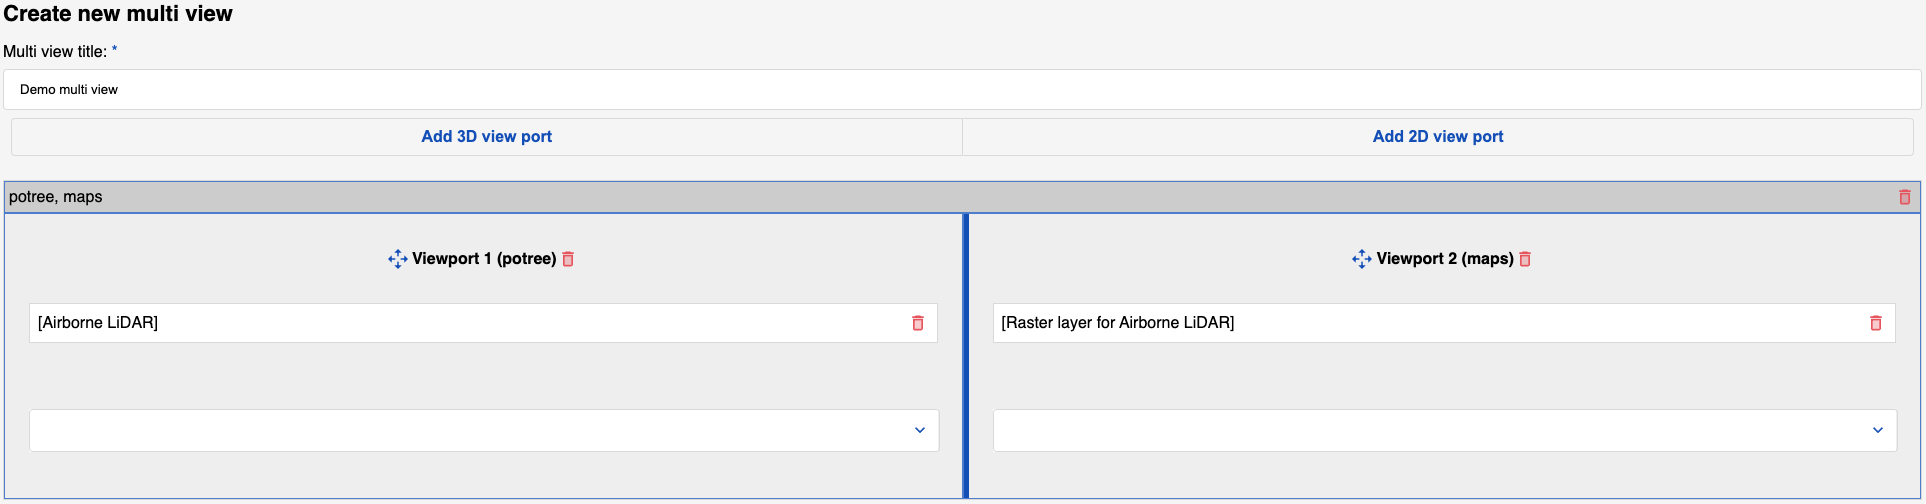
Example of the view port configuration, where we choose one 3D and one 2D view port and attached one dataset to each of them.
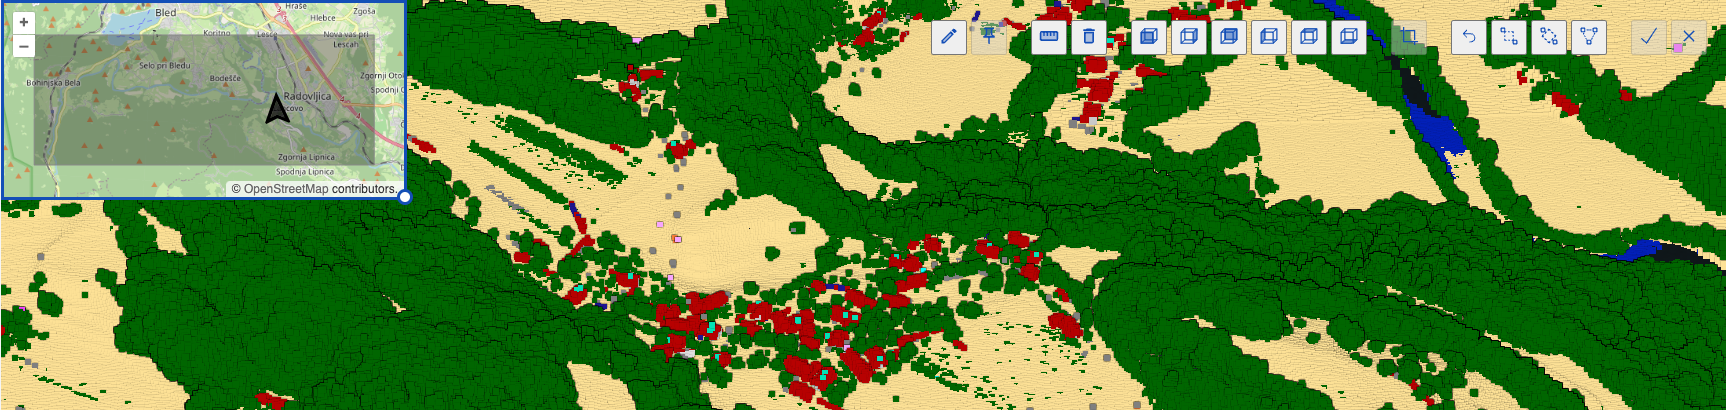
When the configuration meets your needs, click on the save button in the bottom right corner. This will return you to the project page from where you can additionally edit the multi view or open it to explore the data. To ease the data navigation all shown view ports can be synchronized to show the same region while moving around. The synchronization is turned on by ticking the box next to the label Sync in the upper right corner of the screen.
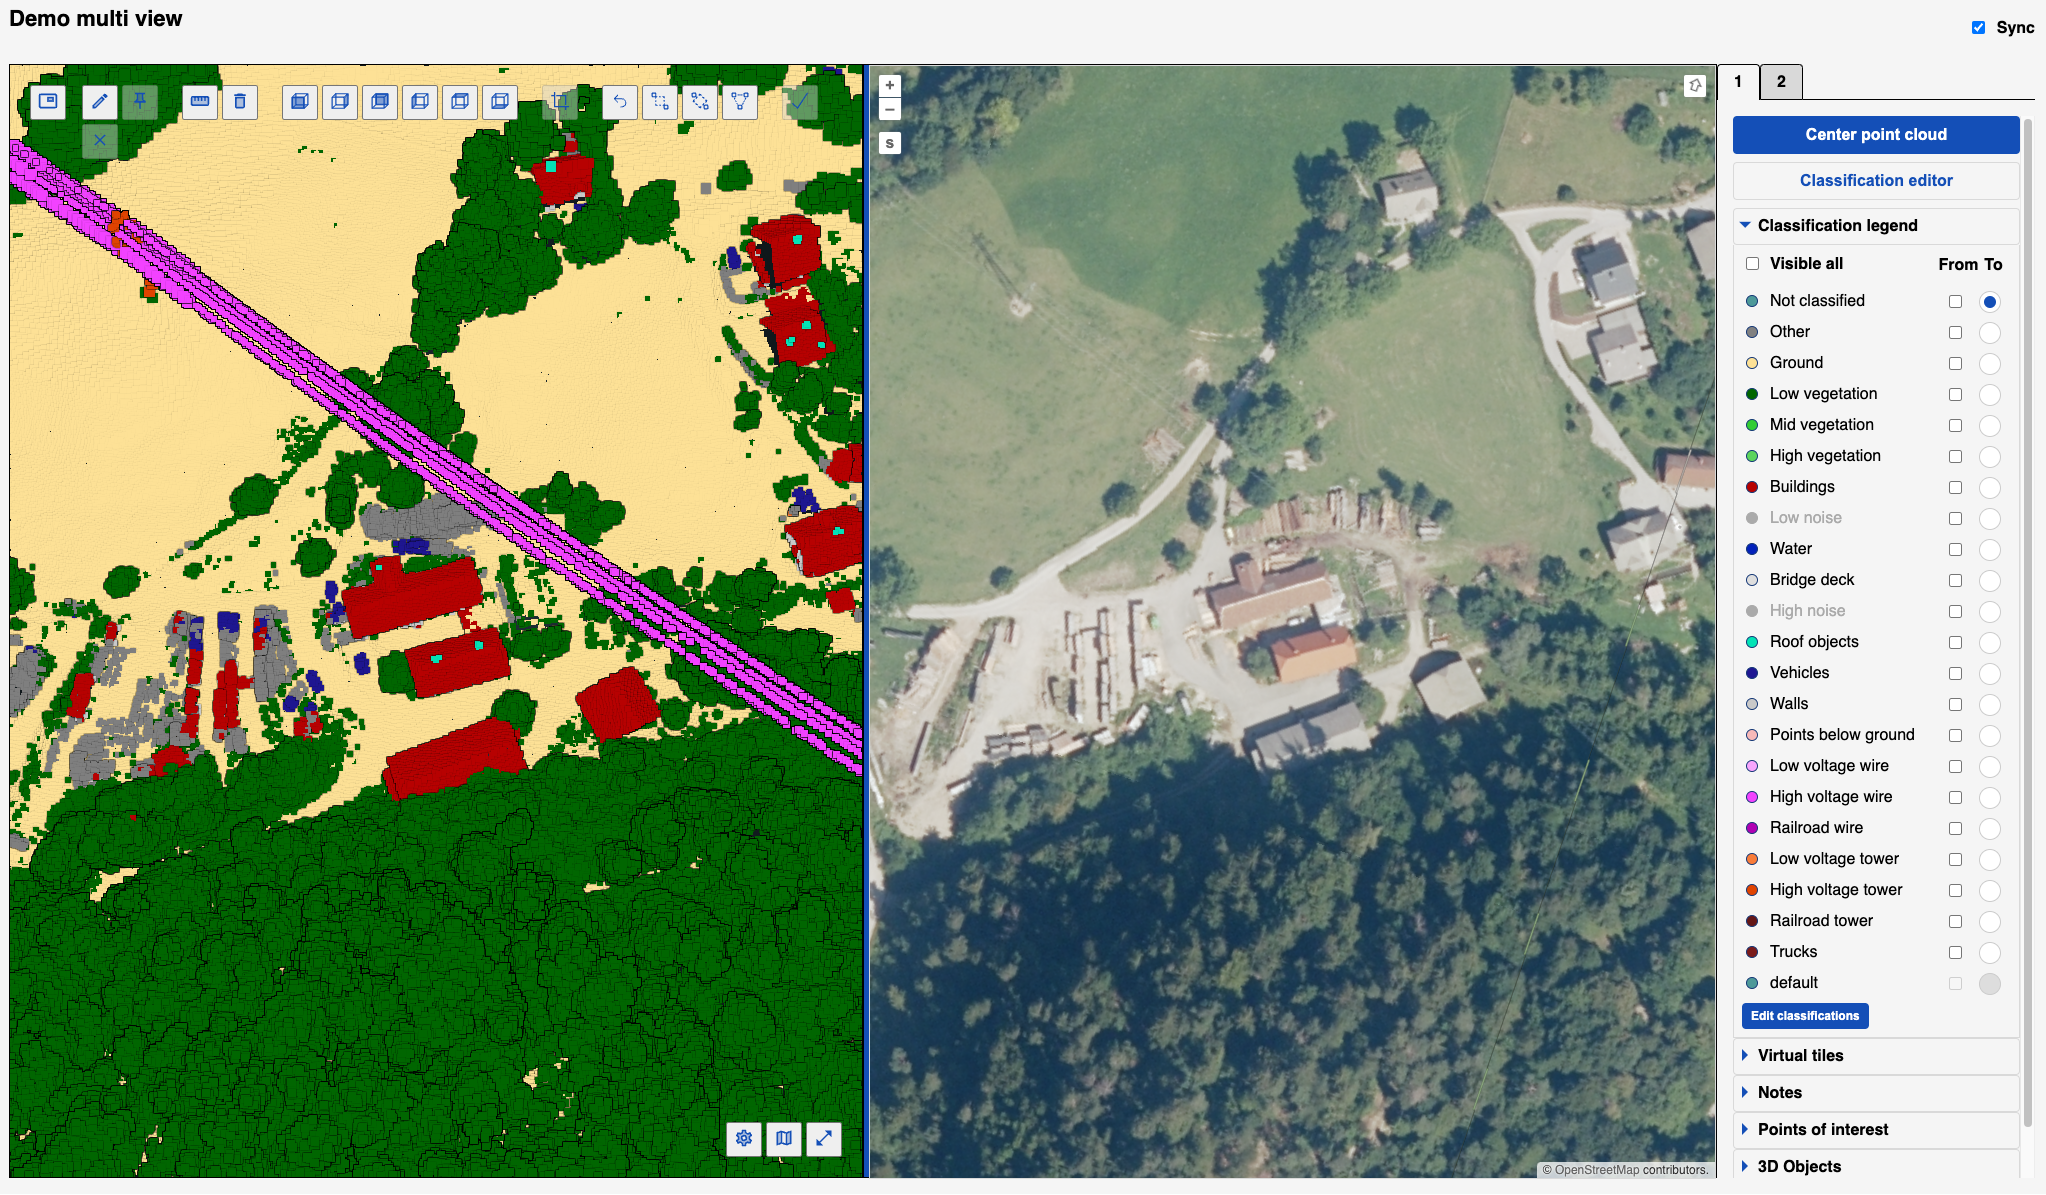
Synchronised view of the classified lidar and raster dataset.
Conclusion
With the possibility of showing multiple types of synchronized datasets, it becomes easier to explore and understand unknown datasets. Adding the option of visualizing multiple features of the same datasets type in separate windows, data annotation becomes even easier with our 3D point cloud viewer.
If you have not yet tried out our web application, create an account and start playing with preloaded demo datasets.
Try our platform
Tags:
Recent Posts
How to Keep Original (Ground) Labels Unchanged When Using Flai Classification
Pushing the Boundaries of Situational Awareness at REPMUS 2025: Our AI-Driven REA Journey