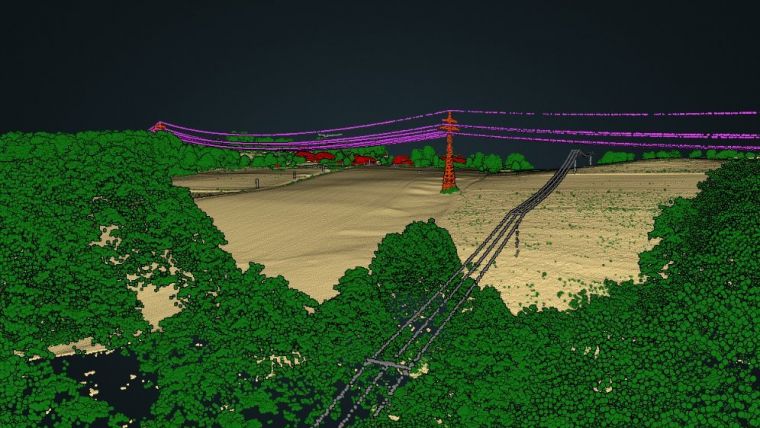
Hero image data courtesy: Federal Agency for Cartography and Geodesy (BKG).
Blaž Vidmar, Nejc Dougan and Barbara Žabota wrote in GIM International about how LiDAR point clouds are being classified for the Digital Twin Germany program, and what that says about automation on national mapping projects. Read the full article on GIM International.
The project
The Digital Twin Germany (DigiZ-DE) initiative, led by the Federal Agency for Cartography and Geodesy (BKG), combines geospatial, environmental and infrastructure data into a single 3D model of the country. It started as a pilot over the Hamburg metropolitan region; the national aerial survey runs from 2024 to 2026 and covers 356,794 km².
Flycom Technologies is responsible for roughly 100,000 km² of that, which makes it one of the largest single contributors to the program. Flai classifies the LiDAR.
Two things make the data unusual for a survey of this size:
- Minimum point density of 40 pts/m². National LiDAR surveys typically deliver around 5 pts/m² (Spain, Slovakia) or 10 pts/m² (France, Portugal, Slovenia).
- Leaf-on acquisition. Data is captured between March and November rather than in the leaf-off season national surveys usually prefer, so vegetation and tree structure can be analyzed.
Classification follows a 12-class scheme based on the ASPRS standard: ground, low, medium and high vegetation, buildings, water, bridges, low and high noise, high-voltage power lines, and a category for other objects such as wind turbines, solar panels, towers and pipelines.
Where AI classification changed the workflow
Four areas are worth singling out.
Noise classification at strip level. Aerial data is collected in strips, and each strip carries slightly different noise patterns that interfere with matching and georeferencing. Beyond the noise classes in the pretrained FlaiNET models, we built a classification step that runs on the full strip before tiling, separating low and high noise from valid data early. Our training data spans RIEGL, Teledyne, Hexagon and other manufacturers, which is what lets the model recognize sensor-specific and environment-specific noise rather than one vendor's signature.
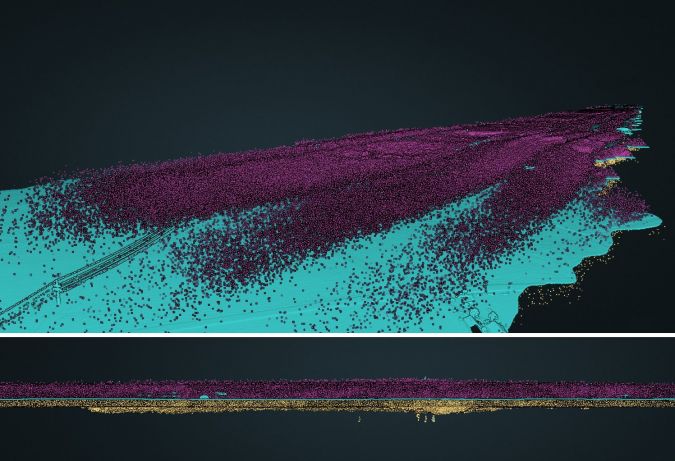
Data courtesy: Federal Agency for Cartography and Geodesy (BKG).
Power line classification. FlaiNET separates power line infrastructure into four classes: high-voltage conductors, low-voltage conductors, high-voltage towers and low-voltage towers. It runs directly on the point cloud, with no vector inputs or auxiliary layers needed as a starting point. That granularity matters when the specification treats high and low-voltage features differently, because remapping is then a quick, consistent step across large areas. Thin conductor segments hold up in dense data, and wires stay separated from towers at line crossings and in heavy vegetation.
Wind turbine detection. Turbines are hard for conventional processing to detect and delimit, and they are exactly the kind of feature a digital twin gets used for downstream, from aviation safety to spatial planning. A dedicated classification class for wind turbines handled it.
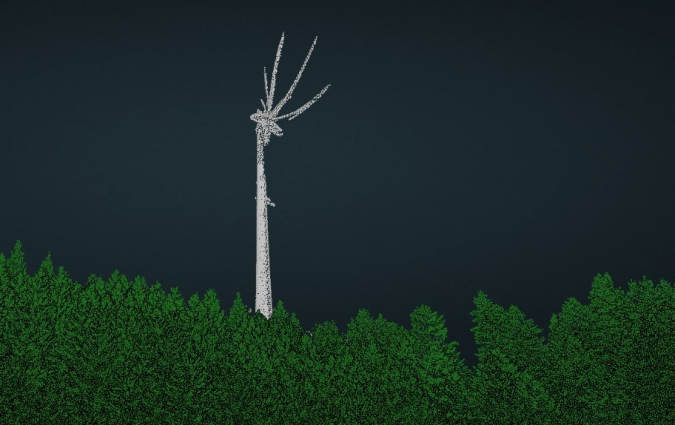
Data courtesy: Federal Agency for Cartography and Geodesy (BKG).
Bridge boundary refinement. The pretrained model detects bridges reliably, but AI models tend to produce soft boundaries between classes in flat areas, so the bridge-to-ground transition can come out uneven. Where downstream work needs clean edges, a post-processing tool sharpens that interface automatically.
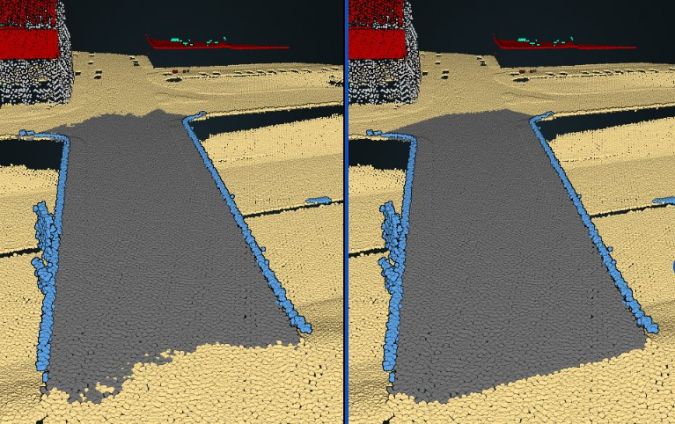
Data courtesy: USGS LiDAR Point Cloud, QL1.
The practical gain across all four is that everything comes out of one pass. Generating more than 20 classes in a single processing run removes the repeated cycles through the workflow and leaves expert time for the decisions that actually need judgement.
Locally or in the cloud
Cloud processing scales, but it also means moving large volumes of data, paying for the transfer, and answering data protection questions. Both options are available. The web app is used for testing, reviewing sample tiles and configuring flows; production runs go through the Flai Cortex CLI.
On this project Flycom held the full dataset on its own systems, and the CLI read and wrote directly to that storage with no extra data movement. The same tool deploys on AWS or another provider when the data already lives in the cloud. The point is being able to run many processes in parallel, wherever the data sits.
Why it matters for national mapping
DigiZ-DE is a working demonstration that automated classification handles both the volume and the technical complexity of a national program. The library of pretrained models covers enough point cloud categories to adapt to different agencies' specifications, and project-specific classes such as wind turbines can be added where traditional methods would need extensive manual work. Because a program like this runs for years under changing conditions, being able to retrain and fine-tune individual classes is what keeps results consistent from the first tile to the last.