Automated classification
Pre-trained AI for LV/HV wires, towers, insulators, guy wires, vegetation and ground, straight from raw LAS/LAZ.
Flai automates the full powerline corridor workflow: classification, vectorisation, vegetation clearance, conductor geometry, defect reporting and change detection, all in one platform, proven at national scale across Europe and North America.
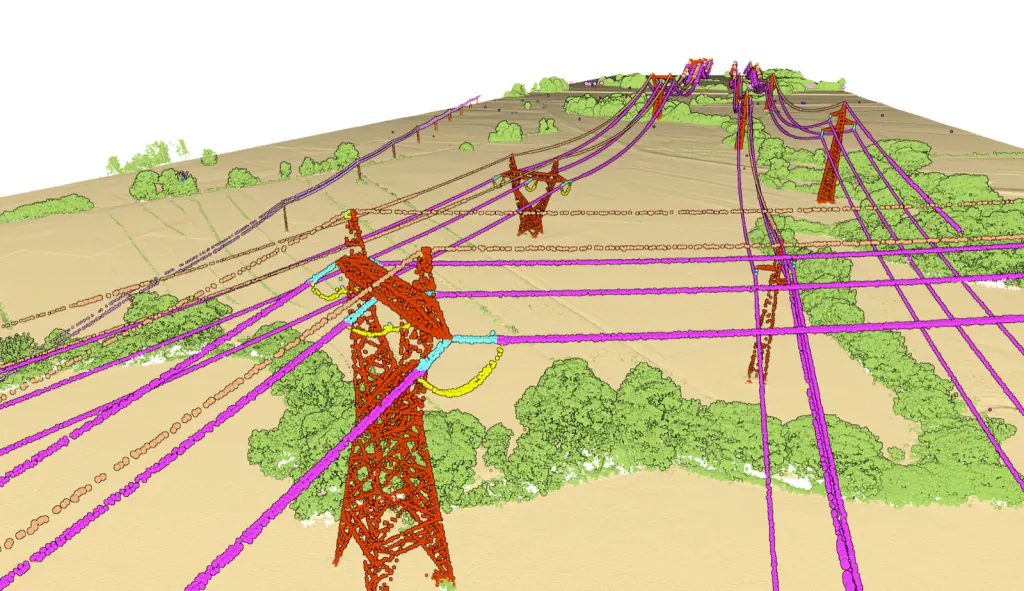
Pre-trained AI for LV/HV wires, towers, insulators, guy wires, vegetation and ground, straight from raw LAS/LAZ.
Conductors and supports detected and vectorised into a full 3D network model, ready for geometric and clearance analysis.
Mass-automated conductor-to-vegetation, conductor-to-ground and conductor-to-structure distances across entire corridors.
Conductor sag, pole inclination, span risk scoring and per-defect violation visualisation, all in one workspace.
Enrich LiDAR with aerial and satellite imagery (e.g. PlanetLabs) for tree-species classification, growth tracking and habitat context.
Extend the schema with custom classes: distribution transformers, switchgear, dampers or any object you care about.
Fine-tune the powerline AI on your own annotated data, on Flai cloud or fully on-prem. No data leaves your network.
LAS / LAZ / COPC in, CSV / XLS / SHP / GeoTIFF out, plus a REST API and QGIS plugin for direct GIS integration.
LAS, LAZ, COPC, E57, PLY. All major airborne and UAV sensors, including DJI L2.
Noise and cluster filtering, OSM masks, ground refinement, flight-line cleanup.
Pre-trained utility model: wires, towers, insulators, vegetation, ground.
Conductor fitting, tower extraction, GIS-ID matching, span topology.
Clearance, sag, lean, defect catalog. CSV / XLS / SHP / API.
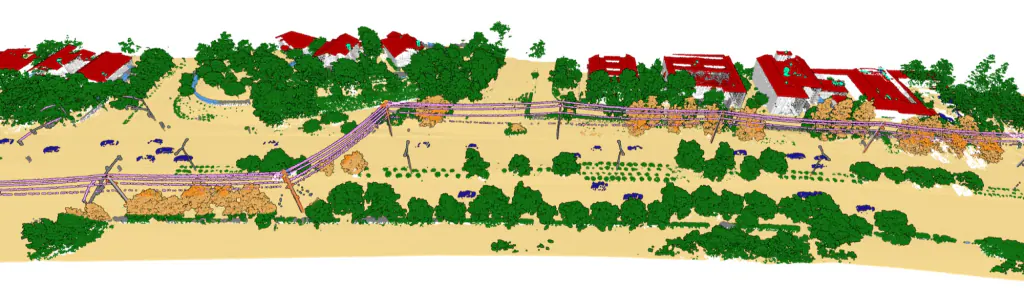
Beyond the broad classes, the dedicated powerline model resolves the fine hardware that inspection and vegetation-management workflows depend on.
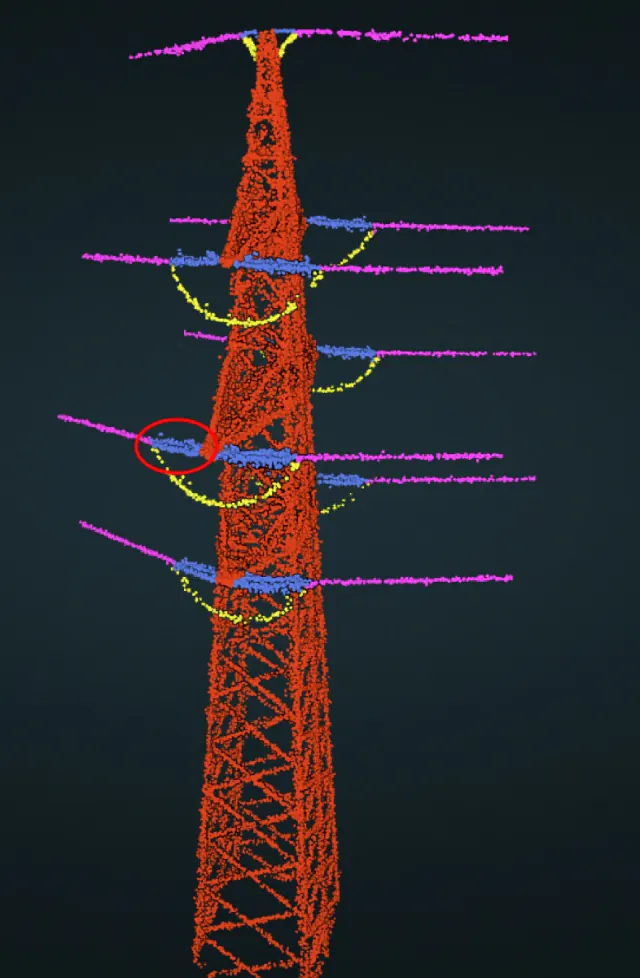
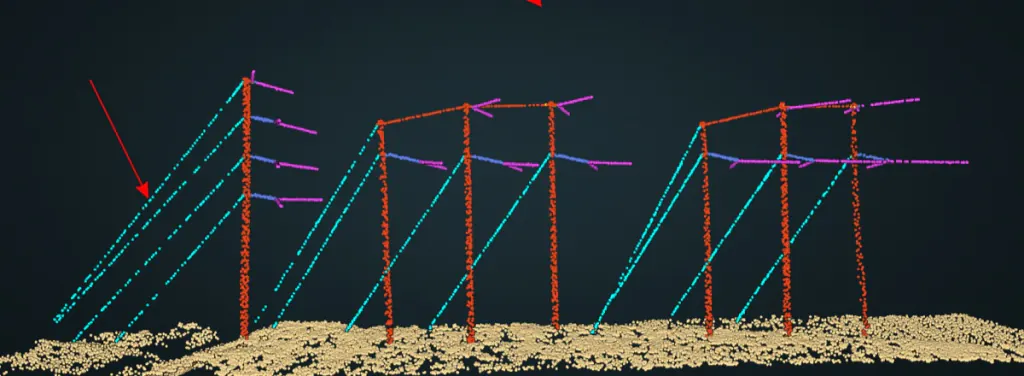
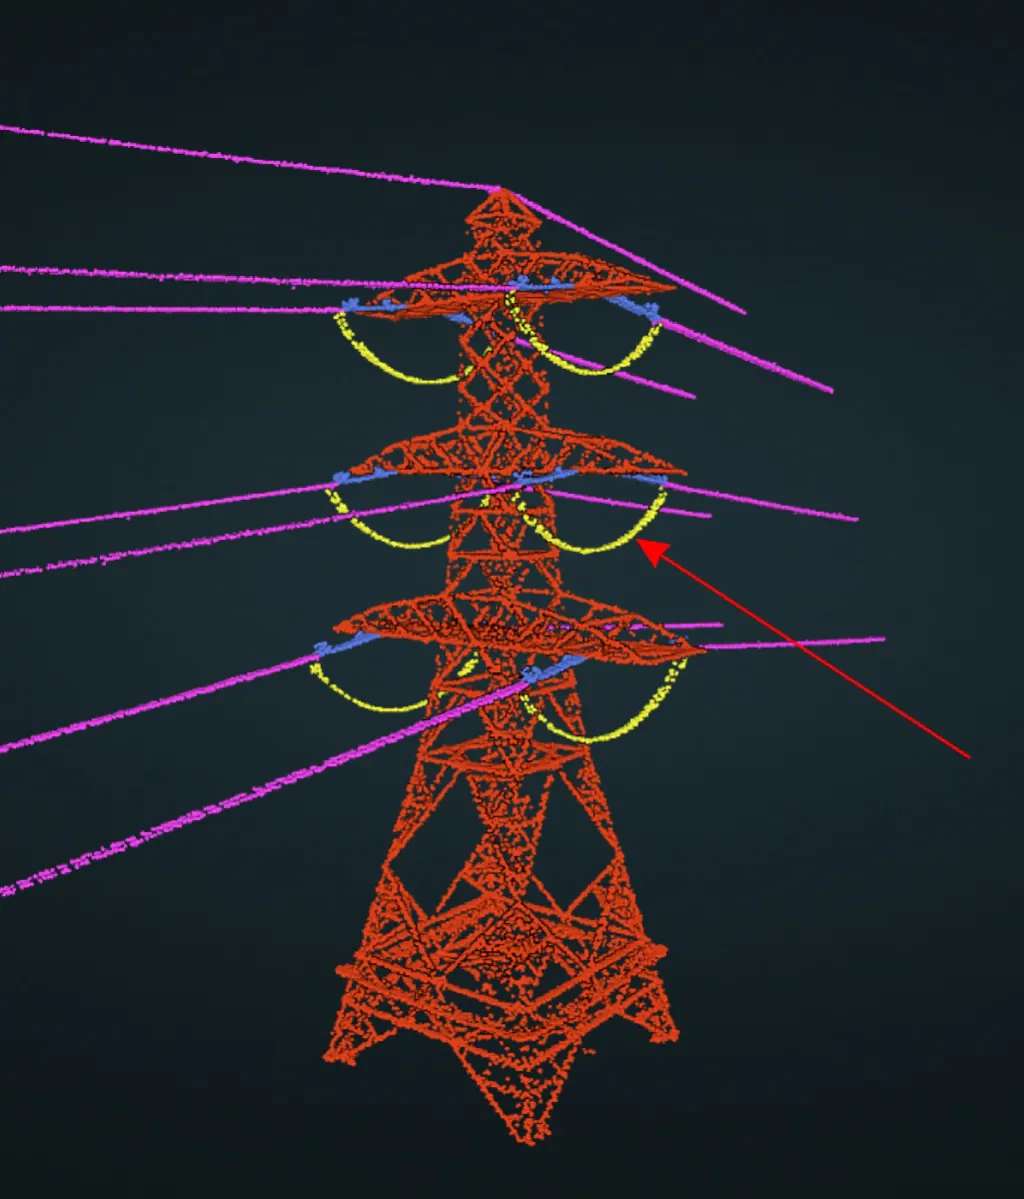
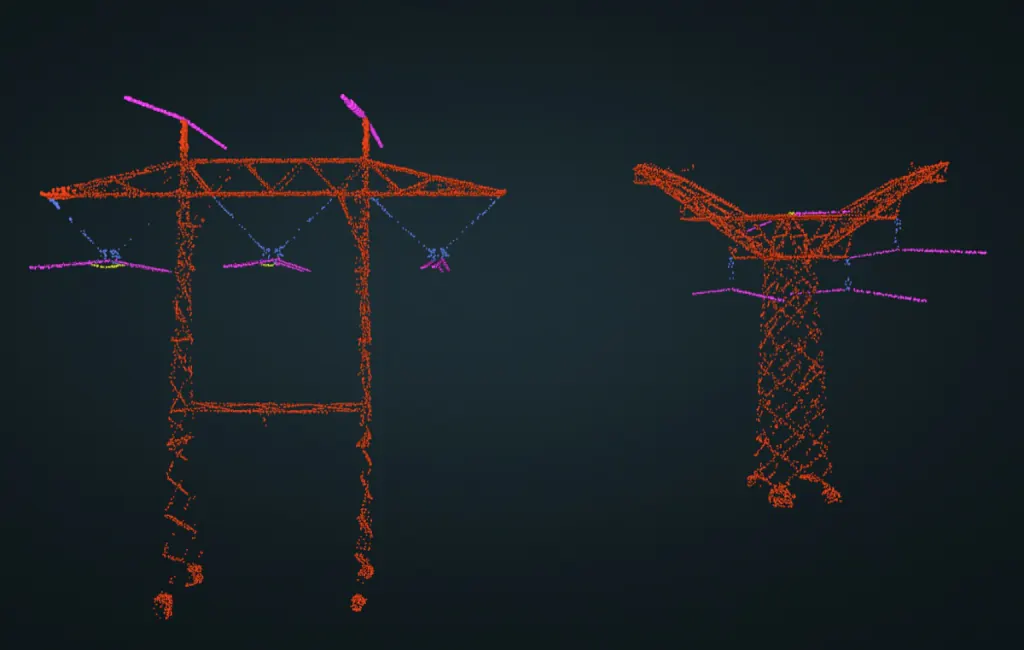
Highlighted classes are the powerline-specific hardware. Colours match the Flai powerline classifier.
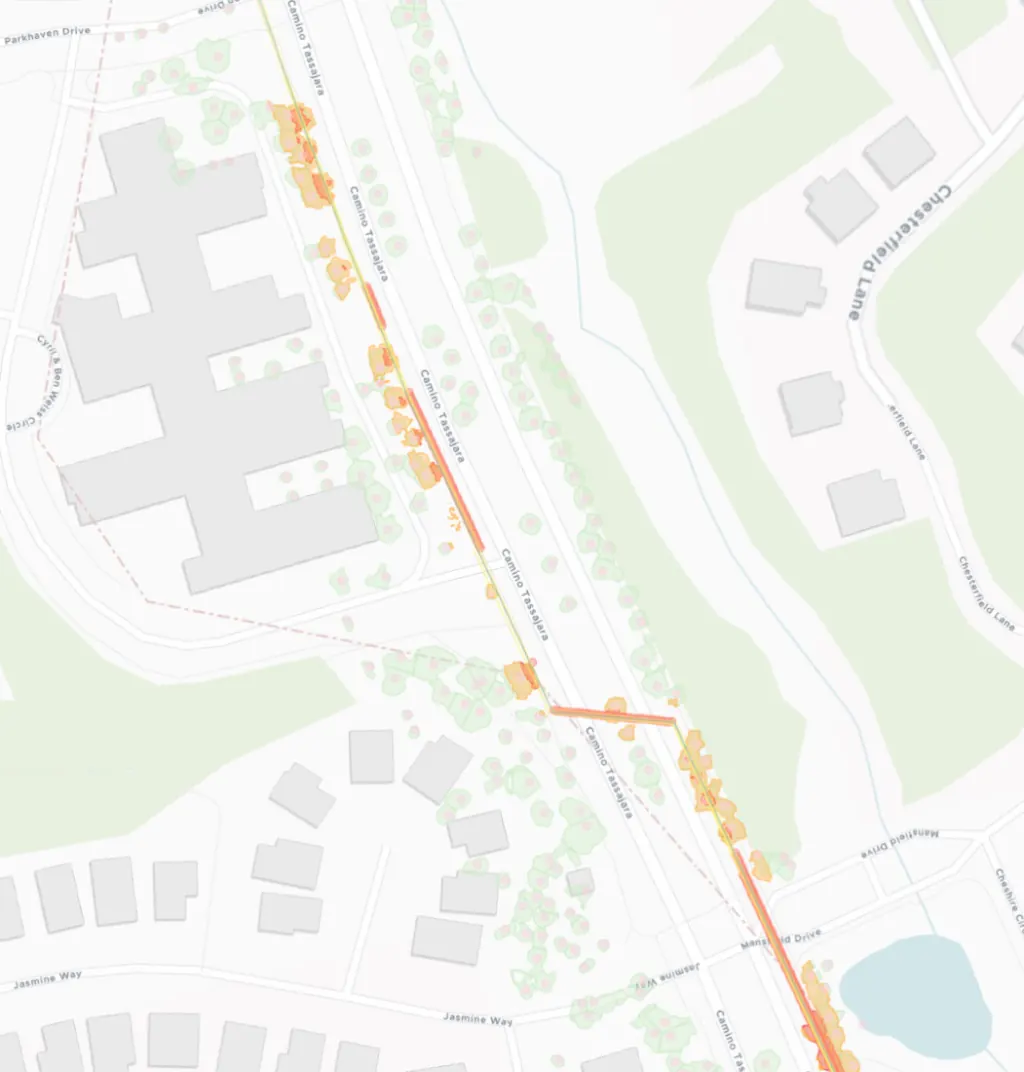
Pair the segmented conductors with vegetation to compute conductor-to-vegetation distance automatically, flagging growth inside the clearance envelope. The result is a prioritised, span-by-span map: which trees threaten the line, where, and how urgently to cut.
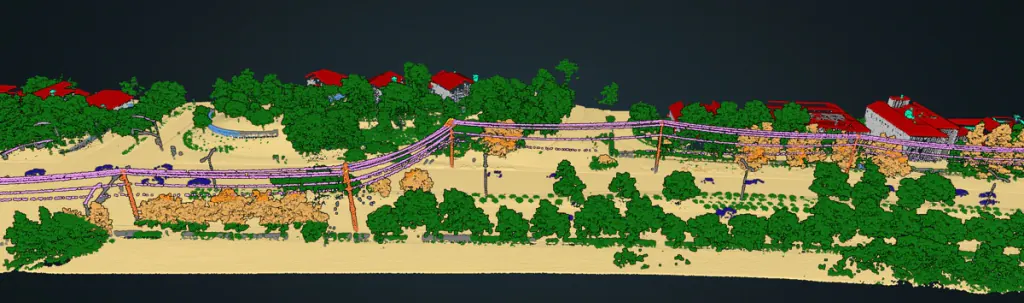
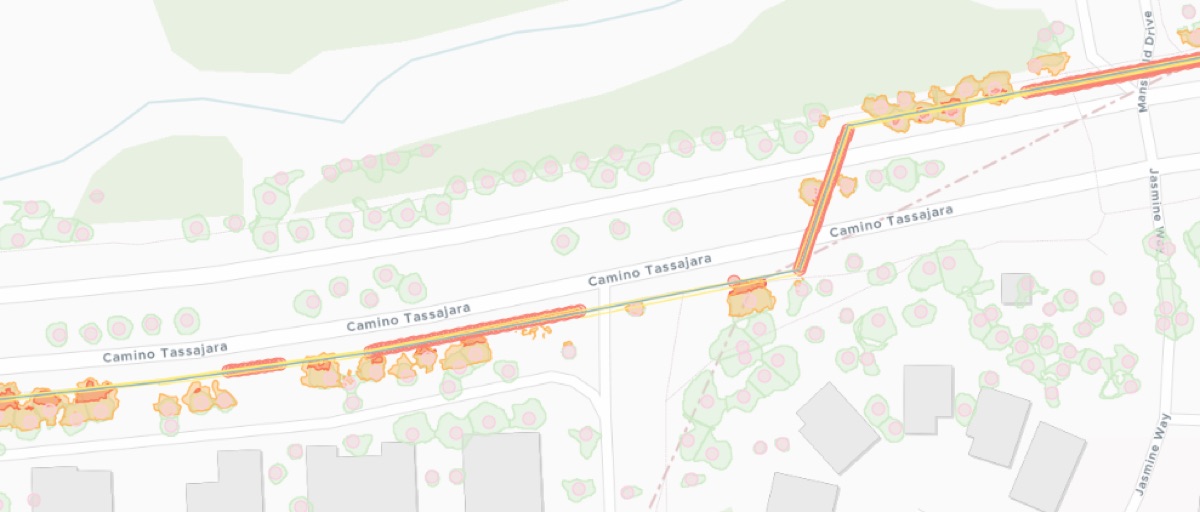
Every tower, conductor and piece of hardware becomes a typed, geolocated asset. Flai vectorises the corridor into a 3D network model with span topology and GIS-ID matching, so the classified cloud drops straight into your GIS as a queryable asset inventory, ready for inspection planning and maintenance.
F1 scores on benchmark powerline data, straight from the pre-trained utility model.
| HV wires | F1 0.99 | |
| Ground | F1 0.98 | |
| Buildings | F1 0.97 | |
| Vegetation | F1 0.95 | |
| Towers / poles | F1 0.93 |

"Using Flai cut down the time for our manual point cloud classification by a factor of four, radically improving our turn-around and project profitability."

AWS EU-Central (Frankfurt) by default. Production-grade, monitored, 99.9% uptime SLA. Onboarding in days.
Dedicated deployment in your own GCP, AWS or Azure. Full data sovereignty, separate release pipeline.
The Flai CLI runs entirely behind your firewall. Air-gap supported, with only metadata for licence validation.
From raw LiDAR to a grid-ready 3D network, at national scale. Cut manual work and deliver consistent, accurate results.