
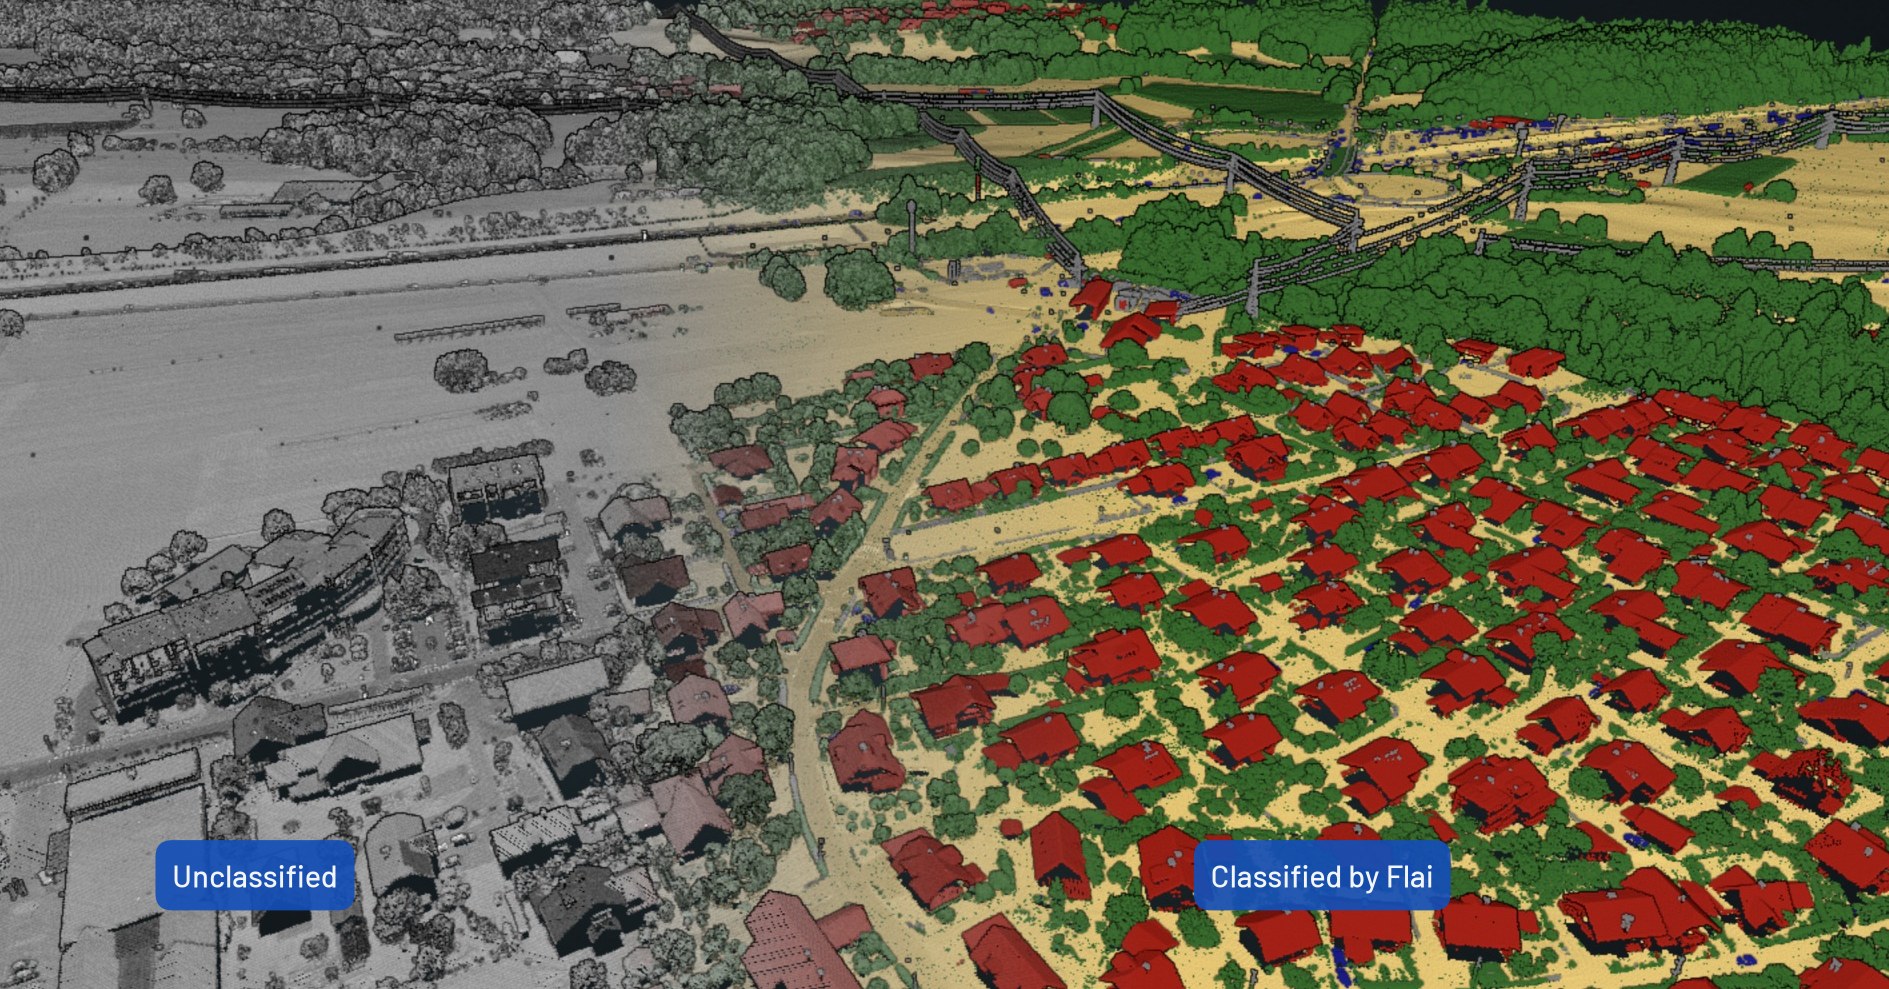
Ask what LiDAR classification costs per km2 and you get a price list for everything except the thing you asked about. Sensor rental, flight hours, per-acre survey rates. The classification step, the part where somebody turns a raw point cloud into a delivery-ready file, is quoted as "depends on the project" or buried inside a lump-sum processing line.
It is not a small line. Processing routinely accounts for 20 to 40 percent of total LiDAR project cost.
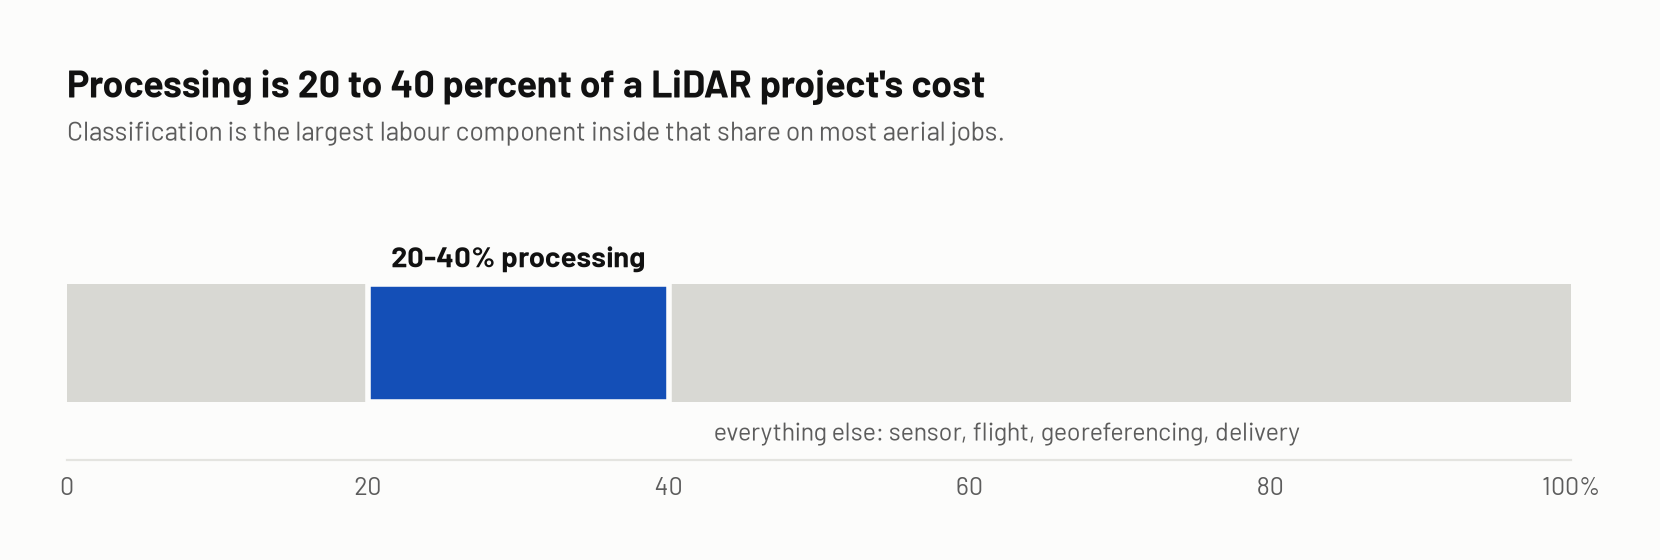
This post breaks the classification step out on its own: the three ways to get it done, what public pricing exists for each, and a break-even model you can run against your own timesheets in about ten minutes.
The three ways to get a point cloud classified
In-house, by an analyst. Someone on your team runs macros or classifies by hand in TerraScan or equivalent, then QCs the result. Cost is analyst hours plus the software seat. Fixed overhead, unlimited use.
Outsourced to a service bureau. You ship the tiles, they ship back classified files, usually with an accuracy report. Cost is a quoted rate per unit of area or corridor length. Pure variable cost, zero overhead, but you give up turnaround control.
Automated in-house. An AI classifier does the first pass, your analyst QCs and corrects. Cost is a per-volume processing fee plus reduced analyst hours. Variable cost, and you keep the data and the schedule.
Most teams end up running two of these at once, which is exactly why the comparison is hard to reason about.
What each one actually costs
Public reference points, as published:
| Path | Published pricing | Unit |
|---|---|---|
| LiDAR survey, all-in | USD 20 to 60 per acre, up to USD 100 to 150 for demanding specs | per acre, whole project |
| Processing share of that | 20 to 40 percent of total project cost | share |
| Outsourced classification | From USD 1,500 ex-VAT for a 5 km corridor, full pass plus accuracy report | per corridor km |
| Cloud classification tools | From USD 89 per month, one credit per hectare | per hectare |
| Flai | From a few euros per km2, decreasing with volume; free trial for online and local | per km2 |
| In-house analyst | Not published by anyone | per analyst hour |
Two traps in that table.
Corridor pricing and area pricing are not comparable. A 5 km corridor at a 200 m swath is about 1 km2. A quote per linear km says nothing about your cost per km2 on a block survey, and converting between them without knowing the swath width produces a number that is confidently wrong.
Per-hectare credits scale differently than they look. One credit per hectare is 100 credits per km2. On a 250 km2 project that is 25,000 hectares, which is a different conversation from the monthly entry price.
The number nobody publishes: analyst hours per km2
Every path above eventually reduces to one figure: how many analyst minutes it takes to get one km2 from raw tile to delivery-ready file. That figure decides whether automation pays for itself, whether outsourcing is cheaper than your own team, and what your real margin is on a fixed-price bid.
Nobody publishes it. Not the software vendors, not the service bureaus, and not us in a form that would apply to your terrain. Search for it and you get "manual classification is time-intensive" and no numbers.
There are honest reasons. It swings by a factor of five or more with terrain, point density, class schema, and delivery spec. A rural block at 8 pts/m2 with three classes is not an urban corridor at 20 pts/m2 with fifteen. Any single published figure would be marketing, not data.
But you can measure your own in one project cycle, and it is the most valuable number in your production process:
- Pick a delivered project with a known area in km2.
- Pull the booked hours from the automated output to the delivery-ready file. Classification and QC and correction, not flight planning, not georeferencing.
- Divide. That is your baseline, in minutes per km2.
- Do it separately for urban and rural tiles. The blended figure hides the decision.
If your team does not book time at that granularity, this is the argument for starting. Everything below needs that one number.
The break-even model
With your baseline, the question stops being "is automation worth it" and becomes arithmetic. Here is the model, with a worked example. Every input marked as an assumption is yours to replace.
Project: 250 km2, mixed urban and rural, 16 pts/m2 Analyst cost: EUR 45 per hour, fully loaded (assumption, use your own) Your baseline: 20 minutes per km2 from automated output to delivery (illustrative, use your measured figure)
Current cost of the classification and QC step:
250 km2  x  20 min/km2   =  5,000 min   =  83.3 analyst hours
83.3 h   x  EUR 45/h     =  EUR 3,750
Flai's customer-reported QC time reduction is 50 percent on urban work and 25 percent on rural. Take the urban figure for a mixed project and you are being optimistic; take the rural figure and you are being conservative. Run both:
50% QC reduction  ->  41.7 h saved  =  EUR 1,875
25% QC reduction  ->  20.8 h saved  =  EUR   938
Now the only question that matters. Divide the saving by the area:
EUR 1,875  /  250 km2  =  EUR 7.50 per km2     break-even at 50%
EUR   938  /  250 km2  =  EUR 3.75 per km2     break-even at 25%
If your quoted price per km2 lands under that number, the automation pays for itself on this project from QC time alone. Above it, it does not, and you should say so.
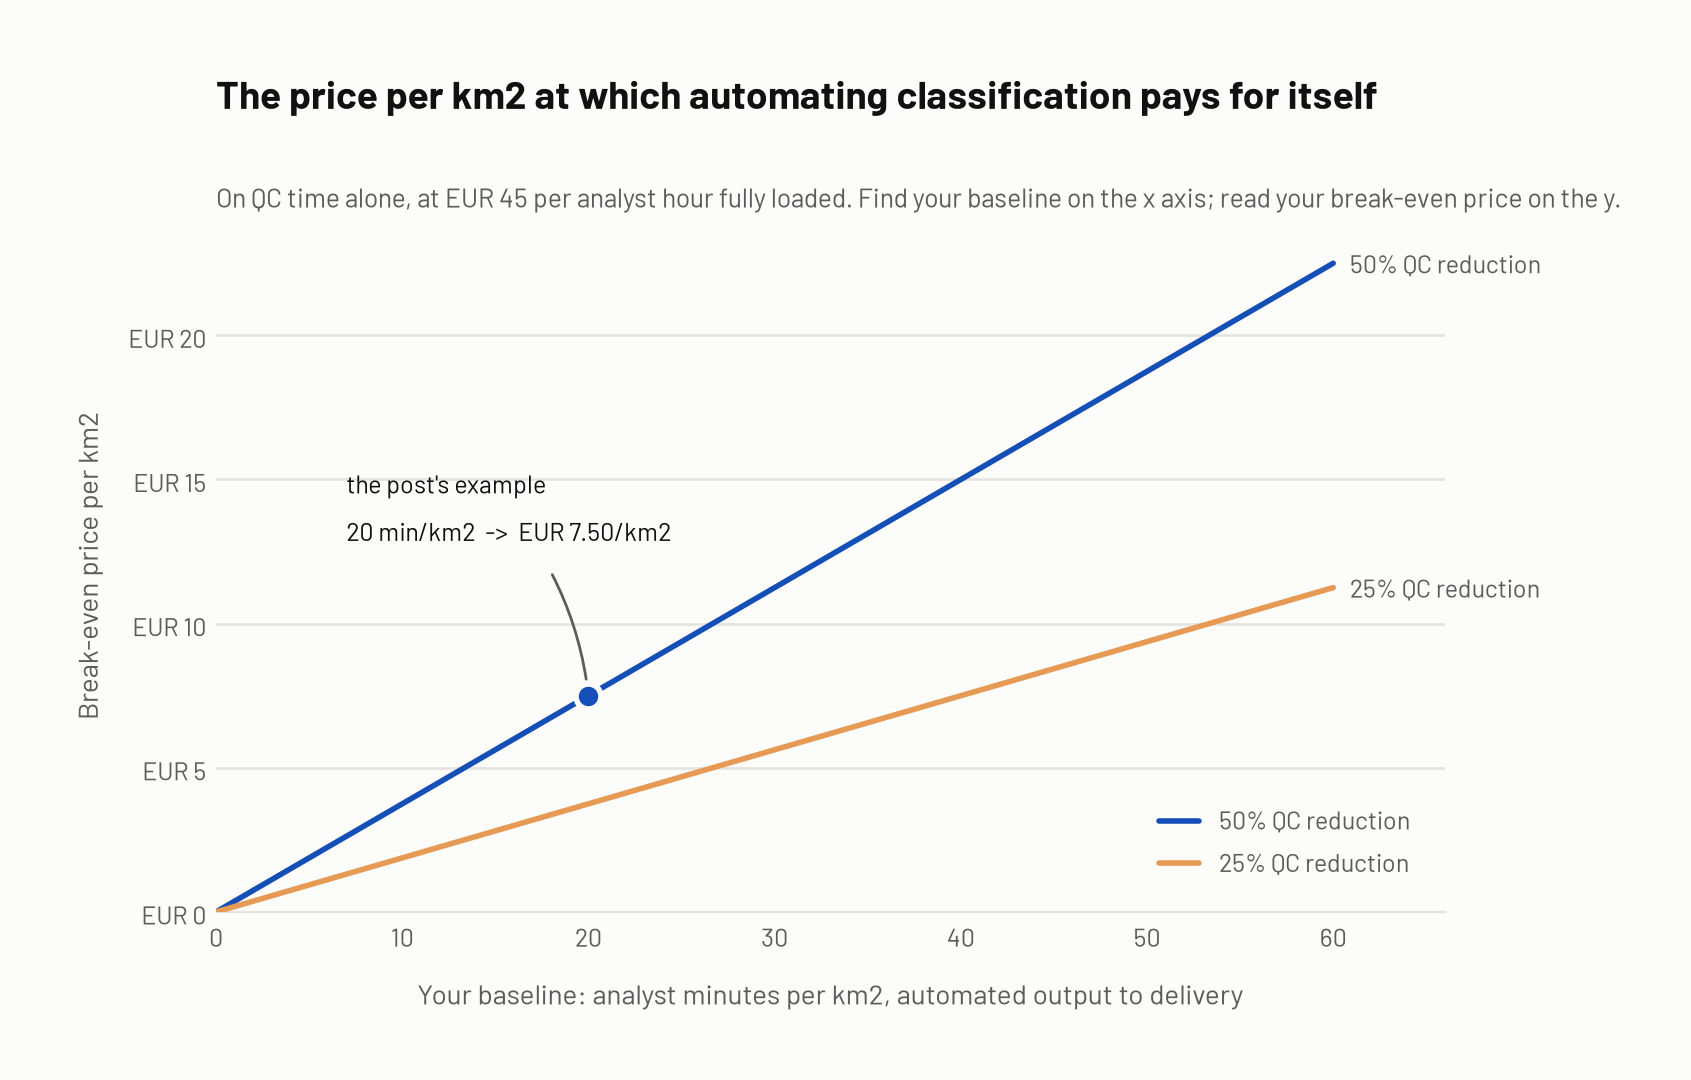
Break-even price per km2 at EUR 45 per analyst hour. Find your measured baseline on the horizontal axis and read your break-even price off the vertical. The two lines are the customer-reported QC reductions: 50 percent on urban work, 25 percent on rural.
The same arithmetic in absolute money, which is the version that goes in front of whoever signs off the spend:
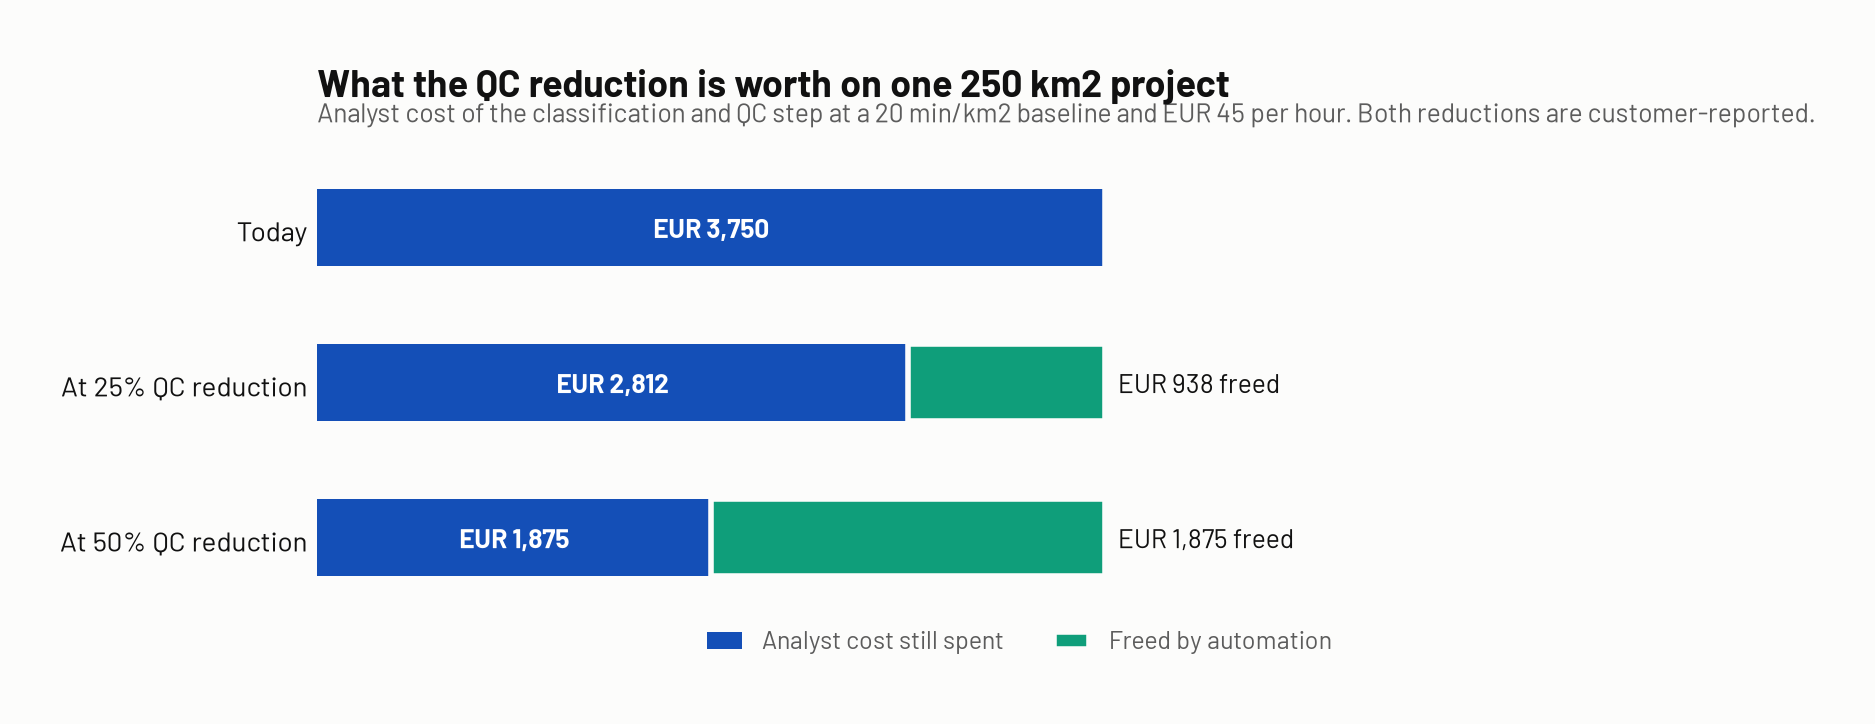
That is the whole model. It ignores everything soft, which is deliberate: if the hard number does not work, the soft arguments should not rescue it.
What the model leaves out, in your favour
- Freed capacity. Those 41.7 hours do not vanish, they go to another project. If your firm is capacity-constrained rather than demand-constrained, this is worth more than the saved cost.
- Turnaround. Flai classifies at under 3 minutes per km2 at 16 pts/m2 on an A10G. On 250 km2 that is the classification pass finishing overnight instead of occupying an analyst for two weeks.
- Consistency. Two analysts classify the same tile differently. A model classifies it the same way every time, which matters when your delivery spec includes a consistency requirement across a large campaign.
- Bid confidence. A measured, repeatable minutes-per-km2 figure lets you bid fixed-price work without padding for uncertainty.
What it leaves out, against you
- QC does not go to zero. The reduction figures are reductions, not eliminations. Somebody still opens the file.
- Automation has a floor. Complex roof geometry, vegetation over buildings, and bridge decks still need a human. Budget for them.
- The first project is slower. Fitting a new step into an established pipeline costs time that the steady-state model does not show.
Why the cheapest per-km2 option often is not the cheapest project
Three things routinely beat the per-unit price.
Fixed versus variable cost. An annual software seat is fixed overhead that gets scrutinised every renewal. A per-project processing cost is a variable cost of production, booked against the project it serves. For a small or mid-size mapping firm this changes who has to approve it and how hard the conversation is, even when the annual totals are identical.
Rework. A cheap classification pass that fails your delivery QC costs the price plus the correction plus the schedule slip. This is why accuracy per class matters commercially and not just technically, and why a blended accuracy figure is not enough to bid on.
Turnaround risk. Outsourcing at a good rate is fine until the client moves the delivery date. Then the queue you do not control becomes the constraint, and the cheap option costs you a penalty clause.
Frequently asked questions
How much does LiDAR point cloud classification cost per km2?
There is no single market rate, because the unit changes with the path. Outsourced classification is typically quoted per corridor km or per project, with published examples from USD 1,500 for a 5 km corridor including an accuracy report. Cloud tools sell credits per hectare, from around USD 89 per month at entry level. Automated classification with Flai starts at a few euros per km2 and decreases with volume. In-house classification has no published rate at all, because it is analyst hours, and that figure swings by more than five times with terrain and delivery spec.
Is it cheaper to outsource LiDAR classification or do it in-house?
It depends on one number you can measure and most teams have not: your analyst minutes per km2 from automated output to delivery-ready file. Multiply by your fully loaded hourly cost and compare to the quote. Outsourcing usually wins on cost when your team is fully booked and loses on turnaround control and iteration speed. Automating in-house tends to win when you have QC capacity but not classification capacity.
How much time does AI classification actually save?
Flai customers report 50 percent less QC time on urban projects and 25 percent on rural, from production work rather than lab benchmarks. Overall classification time reduction runs 30 to 80 percent depending on terrain and class schema. Use the low end when you build the business case; if the numbers work there, they work.
What is the ROI of automated LiDAR classification?
Divide the analyst cost you save by the area processed to get a break-even price per km2, then compare it to your quote. On a 250 km2 project with a 20 min/km2 baseline and a EUR 45 hourly cost, break-even is EUR 7.50 per km2 at a 50 percent QC reduction. Anything below that pays for itself on QC time alone, before counting freed capacity or faster turnaround.
Do I still need TerraScan if I automate classification?
Yes, and that is the normal setup. Flai writes standard LAS/LAZ with ASPRS class codes, so output opens directly in TerraScan for QC, correction and delivery. Automation replaces the classification pass, not the QC and editing environment.
What does classification cost as a share of a LiDAR project?
Processing as a whole typically runs 20 to 40 percent of total project cost. Classification is the largest labour component inside that share on most aerial jobs, which is why it is the line worth modelling separately rather than accepting as a lump sum.
Conclusion
The reason LiDAR classification cost is hard to pin down is not that vendors are hiding it. It is that the dominant cost on most projects is analyst time, and almost nobody measures their own analyst time per km2 well enough to compare anything to it.
Measure that one figure and every other decision gets easy. You can price a fixed-bid project without padding. You can tell whether outsourcing is genuinely cheaper than your own team. And you can calculate, in one line, the price per km2 at which automating the classification pass pays for itself: your saved analyst cost divided by your project area.
One thing the example understates. It assumes the common classes: ground, vegetation, buildings, and noise filtering. That is the cheap end of the problem and the part where a well-tuned macro chain is most competitive, which is why the numbers above are the conservative case.
The economics move sharply once your delivery spec asks for more. Powerlines and towers, bridges, vegetation split into strata, street furniture, rail, vehicles: each additional class is manual work that geometric routines do not meaningfully automate, so the saving climbs well past the range in the worked example. Past a certain class count it stops being a saving at all and becomes a feasibility question. Nobody is hand-classifying twenty-plus classes across a national campaign on a commercial schedule. If your spec is that wide, the comparison is not cheaper against dearer, it is possible against not possible.
Run the model on your last delivered project, on the classes you deliver today. If automation does not clear the break-even on your real numbers, it is not worth buying, and that is a legitimate answer. Then ask the second question: what would you bid on if the class list were not a constraint?
Run the model on real numbers. Send us a tile set from a project you have already delivered. You get the classified file back, the per-class accuracy against your QC'd version, and the measured processing time, so the break-even calculation uses your data instead of assumptions. Request a benchmark