
Evaluation of FLAI AI Classification on LiDAR Data Collected with the AISPECO Heliux LITE System and RIEGL VQ-580 II-S
- Jan 21
- 13 min read
Updated: Jan 21


1. Introduction
The purpose of this document is to evaluate how FLAI’s AI-based point-cloud classification performs on LiDAR data collected with the AISPECO HELIUX LITE airborne system equipped with a RIEGL VQ580 II-S sensor.
This study examines classification behavior across several environments – rural, urban, industrial, and powerline corridors – to provide a realistic view of performance under different point densities, flying altitudes, and object types.
AISPECO specializes in the development of airborne sensor integration platforms, enabling flexible deployment of high-end LiDAR sensors and cameras on helicopters and light aircraft. For this evaluation, the HELIUX LITE system was used to collect LiDAR datasets at altitudes of 540 m and 810 m AGL.
FLAI is a geospatial technology company focused on automating the classification and analysis of LiDAR point clouds using AI. The solution supports data from airborne (manned, UAV), mobile, and SLAM platforms, leveraging pre-trained and customizable AI models to automatically classify point clouds into meaningful categories such as terrain, vegetation, buildings, and infrastructure. Their classifier was applied directly to AISPECO-collected point clouds without manual modification, providing an objective assessment of performance.
“The overnight turnaround and classification quality suggest that AI point-cloud processing is now viable for real-world workflow.” Mantas Vaskela, CEO, AISPECO.
The results show how FLAI’s AI classification interprets airborne data acquired using the HELIUX LITE + RIEGL VQ-580 II-S setup, identifying both strong performance areas and limitations linked to point density, flight altitude, and object characteristics.
2. Platform and Payload
2.1 AISPECO Heliux LITE system
For this study, the AISPECO Heliux LITE airborne system was used as the primary integration platform. HELIUX LITE is a compact, lightweight sensor pod designed to be mounted on light aircraft and helicopters, enabling flexible deployment of high-end airborne sensors for mapping, inspection, and surveying missions.
The Heliux LITE platform provides:
Modular mounting for LiDAR and camera systems
Streamlined integration without the need for aircraft modification
Rapid installation/removal
Support for multiple sensor configurations
Reliable performance for corridor and wide-area missions

Specification | Details |
Maximum Payload Weight | Up to 50 lbs total |
Frontal Area | 1 sq. ft. |
Cabling | Fiber optics cabling |
Certification | EASA/FAA approved structural substantiation |
Maximum Sensor Configuration | 5 sensors |
Antenna | Removable |
Figure 1: AISPECO Heliux LITE specifications
2.2 Integrated LiDAR Sensor: RIEGL VQ-580 II-S
The Heliux LITE system was equipped with a RIEGL VQ-580 II-S, a high-performance airborne laser scanner commonly used for medium-altitude mapping missions.
This sensor was selected for the study due to its:
High measurement rate suitable for 540 m and 810 m AGL flights
Ability to achieve point densities between 18–45 pts/m²
Strong performance over diverse environments, including urban areas, forested zones, and infrastructure corridors
Proven reliability for powerline inspection - a core use case in FLAI’s classification workflows
Tech Data Overview | ||||
Laser Pulse Repetition Rate PRR | 300 kHz | 600 kHz | 1200 kHz | 2000 kHz |
Laser Power Level | 100 % | 100 % | 100 % | 100 % |
Max. Measuring Range (p ≥ 60%) | 2460 m | 1860 m | 1390 m | 1100 m |
Max. Measuring Range (p ≥ 20%) | 3720 m | 2880 m | 2200 m | 1780 m |
Minimum Range | 20m | 20m | 20m | 20m |
Max. Number of Targets per Pulse | 15 | 15 | 9 | 5 |
2.3 INS/GNSS: Trimble Applanix AP+50 Air
The airborne LiDAR data was supported by the onboard Trimble Applanix AP+ 50 Air GNSS/INS
system integrated within the Heliux LITE platform.
This system provides precise position and attitude measurements required for accurate LiDAR
georeferencing. Post-processing of trajectory data was performed using Applanix POSPac, ensuring high-accuracy alignment between the LiDAR measurements and aircraft navigation data.
Absolute Accuracy Specifications1.9 (RMS). Airborne Application | |||||
SPS | SBAS10 | RTX3 | Post-Processed-RTX5 | Post-Processed4 | |
Position (m) | 1.5 H 3 V | 0.50 H 0.85 V | 0.04 H 0.08 V | 0.03 H 0.06 V | 0.02 H 0.05 V |
Velocity (m/s) | 0.050 | 0.050 | 0.010 | 0.005 | 0.005 |
Roll & Pitch (deg) | 0.010 | 0.008 | 0.005 | 0.005 | 0.005 |
True Heading (deg) | 0.070 | 0.050 | 0.020 | 0.010 | 0.010 |
2.4 Aircraft
The Heliux LITE pod was mounted on a Cessna 172 aircraft for the data acquisition flights used in this study. The Cessna 172 is a widely adopted platform for airborne LiDAR mapping due to its:
Stable and predictable flight characteristics
Suitable cruise speeds for medium-altitude scanning
Ability to support long, uninterrupted mapping missions
Easy and repeatable installation of the Heliux LITE system
Using the Cessna 172 ensured consistent operating conditions for evaluating the performance of the
Heliux LITE + RIEGL VQ-580 II-S configuration and the subsequent AI classification workflows provided by FLAI.

3. Test Field
The evaluation was conducted using four representative airborne LiDAR datasets collected with the AISPECO HELIUX LITE system and the RIEGL VQ-580 II-S sensor. These datasets were selected to cover a broad range of real-world environments where AI-based classification tools are typically applied.
Together, they represent rural, urban, industrial, and utility-focused scenarios.
Each dataset presents unique characteristics and classification challenges, allowing for a
comprehensive assessment of FLAI’s AI classification performance under varying conditions of flight altitude, point density, object complexity, and land-cover diversity.
The datasets used in this evaluation include:
Dataset 1 – Rural Area
This dataset represents a mixed rural landscape consisting of open ground, isolated buildings,
vegetation, and a small forested area.
Area covered: ~2.7 km²
Altitude: 540 m AGL
Point density: ~45 points/m²
Characteristics:
Mostly bare ground
Some scattered buildings and fences
Presence of forest areas
Clean terrain suitable for evaluating ground, vegetation, and building classification
performance
Dataset 2 – Dense Urban Area
This dataset includes complex urban structures such as multi-story buildings, residential blocks, commercial areas, and a river crossing.
Area covered: ~3.4 km²
Altitude: 540 m AGL
Point density: ~34 points/m²
Characteristics:
High structural diversity
Parking lots, roads, bridges
Mixed residential and commercial zones
Useful for assessing building classification detail, vehicle detection, and handling of
reflective surfaces
Dataset 3 – Industrial Area (High Altitude)
This dataset represents a challenging high-altitude scanning scenario over industrial facilities and transportation infrastructure.
Area covered: ~4.4 km²
Altitude: 810 m AGL
Point density: ~20 points/m²
Characteristics:
Large industrial buildings with complex rooftops
Railway lines and vehicles
Lower point density due to higher altitude
Useful for evaluating classification robustness under reduced point densities
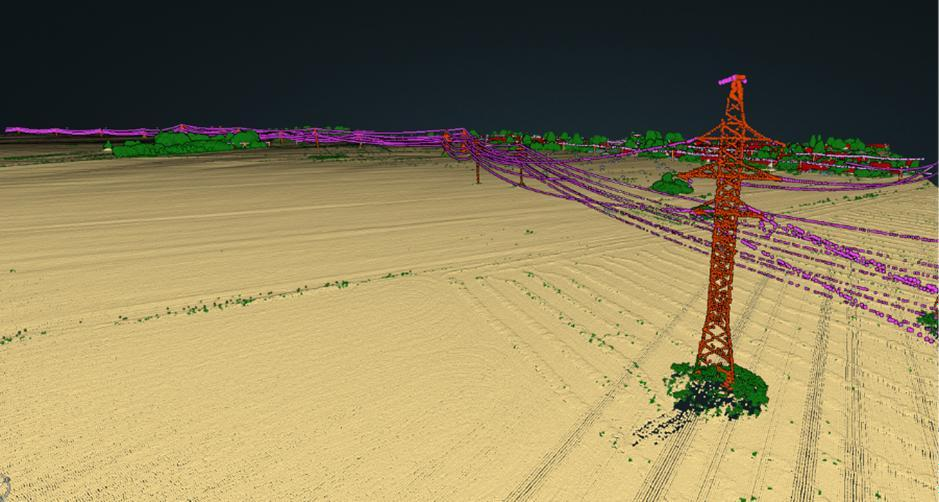
Dataset 4 – Powerline Corridor
This dataset contains transmission and distribution lines, associated pylons, and surrounding terrain.
Altitude: 540 m AGL
Point density: varies
Characteristics:
HV and LV towers
Multiple wire types (with class confusion potential)
Vegetation near poles
Ideal for testing FLAI’s established capabilities in powerline infrastructure
classification
Summary
These four datasets provide a diverse and realistic set of conditions for assessing AI classification performance. They include:
High- and low-density point clouds
Urban, rural, industrial, and corridor environments
Both simple and complex object structures
Typical challenges encountered in real operational mapping missions
This variety ensures that the evaluation reflects practical use cases for AISPECO customers and FLAI end users.
4. Flights
The datasets used in this evaluation were collected during a series of airborne mapping flights
performed with the AISPECO HELIUX LITE system mounted on a Cessna 172 aircraft. The flights
were executed using typical survey parameters for medium-altitude airborne LiDAR missions, providing representative data for rural, urban, industrial, and powerline environments.
Although the datasets were collected on different dates and locations, all missions followed consistent acquisition principles designed to test classification performance under varying conditions of altitude, terrain complexity, and point density.
The following table summarizes the key flight parameters for the datasets used in this study:
Dataset | Environment | Altitude (AGL) | Point Density | LiDAR PRR | Scan Speed |
Dataset 1 | Rural Area | 540 m | ~45 pts/m² | 2000 kHz | 230 lps |
Dataset 2 | Dense Urban | 540 m | ~34 pts/m² | 2000 kHz | 230 lps |
Dataset 3 | Industrial Area | 810 m | ~20 pts/m² | 2000 kHz | 230 lps |
Dataset 4 | Powerline Corridor | 540 m | Varies | 2000 kHz | 230 lps |
Flight Characteristics
Across all datasets, the flights shared the following characteristics:
Aircraft: Cessna 172 with AISPECO Heliux LITE mounted
LiDAR: RIEGL VQ-580 II-S
INS/GNSS: Trimble Applanix AP+50 Air
Pulse repetition rate: 2,000 kHz
Scan speed: 230 lines per second
Flight altitude: 540 m and 810 m AGL
Trajectory: Standard survey lines with consistent overlap
These flight settings align with typical AISPECO acquisition parameters for corridor mapping and widearea surveying, ensuring a realistic basis for evaluating FLAI’s AI classification workflows.
Operational Notes
Higher altitude (810 m) resulted in lower point density, allowing an assessment of
classification performance under reduced resolution.
Urban and industrial datasets included challenging scenes with reflective surfaces, complex rooftops, and sparse line features.
The powerline dataset provided an ideal environment to test classification of HV/LV towers and wires – a core focus area for FLAI’s AI models.
5. Processing Workflow
Following data acquisition, AISPECO performed trajectory and point-cloud processing to produce georeferenced LiDAR datasets.
The resulting point clouds were then classified by FLAI using their AI-based semantic segmentation platform.
5.1 Trajectory Processing
The GNSS/INS data recorded during the flights were processed to produce an accurate aircraft
trajectory. This step refines position and attitude information and provides the necessary inputs for precise LiDAR georeferencing.
Trajectory post-processing ensures:
Accurate roll, pitch, and heading estimation
Stable positioning for all datasets
Consistent results across varying flight altitudes and environments
This forms the foundation for generating high-quality point clouds from the airborne mission.
5.2 Point Cloud Generation
Once the flight trajectory was established, the LiDAR measurements from the RIEGL VQ- 580 II-S sensor were processed to create georeferenced point clouds. This step integrates the refined trajectory with the raw LiDAR data to compute 3D coordinates and associated attributes such as intensity and return information.
The point-cloud generation stage provides:
High-resolution 3D representations of each test area
Uniform data formats for downstream analysis
Unmodified, unbiased input for AI classification
No filtering, thinning, or manual edits were performed at this stage. The intention was to evaluate classification performance directly on the data as collected.
5.3 AI-Based Classification
The georeferenced point clouds were then uploaded to FLAI’s AI classification platform, where
semantic labels were assigned automatically to each point.
FLAI provides a set of pre-trained AI models designed for different geospatial applications, including bathymetry, mobile laser scanning (MLS), forestry, utilities (powerlines), and wide-area mapping. For this evaluation, an airborne mapping model commonly applied in powerline inspection workflows was used.
The sample dataset was classified using Flai’s Aerial Mapping model, which separates the data into the following categories:
Ground
Buildings (divided into roofs, faced and roof objects)
Vegetation
Transmission and distribution structures/poles
Transmission and distribution lines
Railroad wires & towers
Water
Vehicles
Bridge decks
Noise
Fences
Other elevated or man-made structures
For this evaluation:
No manual adjustments were made
No post-processing or rule-based corrections were applied
The results reflect FLAI’s out-of-the-box classification performance on data collected with the AISPECO HELIUX LITE + RIEGL VQ-580 II-S configuration
This provides an objective assessment of how the AI model performs across varying environments and point densities.
6. Results
The datasets collected with the AISPECO Heliux LITE system and processed through FLAI’s AI
classification platform provide a clear view of how the classifier performs across different environments, altitudes, and point densities. The following results summarize FLAI’s observations, AISPECO’s engineering review, and combined insights into classification behavior.
Operational Context: Processing Time and Indicative Cost
The table below shows the classification processing times for the datasets used in this study:
Dataset | Environment | Area | Number of points | Processing time |
Dataset 1 | Rural Area | 2.8 km² | 128.866.286 | 7 min 14 sec |
Dataset 2 | Dense Urban | 3.4 km² | 116.962.619 | 7 min 10 sec |
Dataset 3 | Industrial Area | 4.4 km² | 91.888.579 | 6 min 46 sec |
Dataset 4 | Powerline Corridor | 1.8 km² | 57.779.428 | 6 min 21 sec |
AI-based classification, unlike traditional algorithmic methods, assigns a classification to each and every point in the point cloud individually. As a result, processing time mainly depends on the number of points, not on the number of categories used in the classification.
Indicative costs for AI-based classification are volume-based and depend on factors such as the AI model used, point density, and whether processing is performed online or locally. Pricing typically starts at a few euros per linear km² and decreases with higher processing volumes. Entry-level options are available for smaller projects, while discounted rates apply for larger-scale use. Free trials are available for both online and local deployments.
6.1 FLAI Observations
FLAI reviewed all four datasets and provided classification outputs along with visual examples. The input data processed through the Flai classifier was of good quality, with minimal noise and sufficient density to achieve reliable classification results.
From Flai’s perspective, the results of the four sample datasets are consistent with what we typically observe and expect from our classifiers. The greatest value is seen in accurate detection and classification of dense complex urban areas, where many different features need to be identified, and in the reliable detection of utility features, including powerline wires and towers.
As the dataset was collected as a single strip, some minor downgrade in classification is noticeable in areas further from the centerline of the flight path, due to shadow effects and reduced point densities.
Flai classification is typically applied on georeferenced, matched, and tiled datasets rather than on raw flight strips, with the exception of the noise classifier, designed to work on entire flight strips.
As with any automated solution, 100% accuracy is not guaranteed. Some classification errors remain in the datasets - for example, large industrial buildings that were not fully classified due to the method limitations, occasional overlaps between similar classes, and challenges posed by unique & complex objects.
Rural Area
A rural area with few buildings and some power lines. Most of the terrain is bare ground with a larger forested section. The classification is relatively straightforward, as most points fall into ground and vegetation classes. The few buildings and powerline wires present were accurately detected.

Dense Urban Area
The dense urban area presents higher classification complexity, where Flai performed with high
accuracy across single-family neighborhoods, block buildings, and larger commercial structures, including the correct detection of the river and bridge. Some misclassifications were observed in the building and ground classes, particularly in the area of a complex multi-level highway intersection and a specific low-rise building.


Industrial / Dense Urban Area (High Altitude)
A dataset partially similar to the dense urban area, but captured at a slightly higher altitude, resulting in lower point densities. Unlike the dense urban dataset, this section includes an industrial zone with several large industrial halls and structures. The overall complexity is higher. Some of the larger structures were classified correctly, while the largest posed challenges to the classifier. An additional issue was observed with large hedges, where limited or no laser penetration led to classification difficulties and some class mixing.


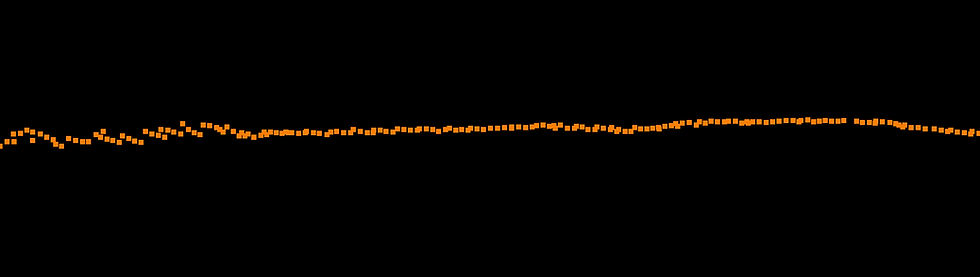
Powerline Corridor
A dataset containing transmission lines running across its length. Most of the area is bare ground, with a small residential section. Powerline detection is highly accurate, though there is some minor mixing between powerline-related classes. Since the dataset consists of a single strip, point densities on the wires are limited. Using multiple strips or flight passes would likely improve point density, resulting in better detection of powerlines and reduced class mixing.

6.2 AISPECO Engineering Review
AISPECO’s Head of R&D reviewed the classification results and provided engineering feedback based on the behaviour of the AI model across the different datasets. His comments highlight areas where the model performed well and areas where inconsistencies or misclassifications appeared.
Ground and Low Points
Ground classification was generally consistent across datasets, although some post- processing is recommended to refine the surface.
Low near-ground points showed occasional inconsistencies, particularly in more complex terrain.


Buildings
Larger building rooftops were classified reliably, while some smaller structures showed partial or inconsistent classification, especially in areas with lower point density.


Vegetation
Vegetation was detected well. Height differentiation (low/medium/high vegetation) is not included in the model and would require additional post-processing.

Towers and Wires
Powerline-related structures were classified, but some class mixing occurred between tower elements and wire classes, particularly where point density decreased or vegetation interfered.


6.3 Performance Across Conditions
The classification results across all four datasets show clear performance patterns influenced mainly by altitude, point density, and object complexity.
Altitude and Point Density
Higher point densities (540 m AGL) resulted in more stable and complete classifications, especially for buildings and vegetation.
Lower-density data (810 m AGL) showed reduced stability, with partial classification of smaller
structures and less consistent wire detection.
Environment Type
Urban and suburban areas: Larger structures and neighborhoods were classified well;
complex roofs and closely spaced objects led to occasional building/ground confusion.
Rural areas: Ground and vegetation classes were consistently accurate. Buildings
identified, and powerline features detected well, with some minor mixing between low and
high voltage wires (transmission and distribution).
Powerline corridors: Major structures were detected, though wire class stability decreased
in lower-density sections.
Object Scale and Detail
Large, clearly defined objects (big buildings, main towers) were classified more reliably. Small
structures, thin features, and fine tower components were more sensitive to density and showed higher variability.
Influence of Vegetation
Vegetation was identified well overall, though dense vegetation near buildings or towers contributed to local misclassifications.
6.4 Strengths & Limitations
The combined evaluation of all datasets highlights several strengths of the AI-based classification approach, as well as areas where performance decreases under certain conditions.
Strengths
Reliable detection of major object classes, including buildings, vegetation, and terrain
features.
Consistent performance across diverse environments, such as rural, urban, and industrial
areas.
Accurate classification of larger structures, including main rooftops and high- voltage
towers.
Good vegetation classification, even in areas with limited penetration.
Efficient for fast, cost-conscious workflows where fully manual or rule-based classification
would be time-consuming.
Customizable workflows that allow users to do more than 100 different operations on top of
the AI based LiDAR classification
Unlike traditional methods, all classes are generated in a single processing step
Reported time savings include up to 50% reduction in manual quality control for urban areas
and around 25% for rural areas.
Limitations
Reduced stability at lower point densities, particularly affecting smaller buildings,
vehicles, fine tower components, and wire spans.
Occasional mixing of wire classes (HV, LV) and partial misclassification of tower arms.
Building/ground confusion in complex or densely built environments.
Local misclassification near dense vegetation or in scenes with overlapping structures.
7. Conclusions
This evaluation shows that AI-based classification performs reliably on LiDAR data collected with the AISPECO Heliux LITE system and the RIEGL VQ-580 II-S sensor. Across rural, urban, industrial, and powerline environments, the model handled major object classes well, particularly larger structures and vegetation.
Performance was strongly influenced by point density. Higher-density datasets produced more stable classifications, while lower-density data – typical of higher-altitude flights – led to reduced accuracy on smaller objects, wires, and detailed tower components. These behaviours are consistent with common challenges in AI-based airborne LiDAR classification.
Overall, the results indicate that the model is well suited for fast, automated processing workflows where moderate error rates are acceptable. Areas such as wire class consistency, tower component labeling, and vegetation height differentiation present opportunities for further refinement.
The collaboration between AISPECO and FLAI provides a strong foundation for continued
improvements, and future work using additional datasets and parameter adjustments may further enhance classification stability across a wider range of conditions.

