- Jul 15, 2025
- 6 min read
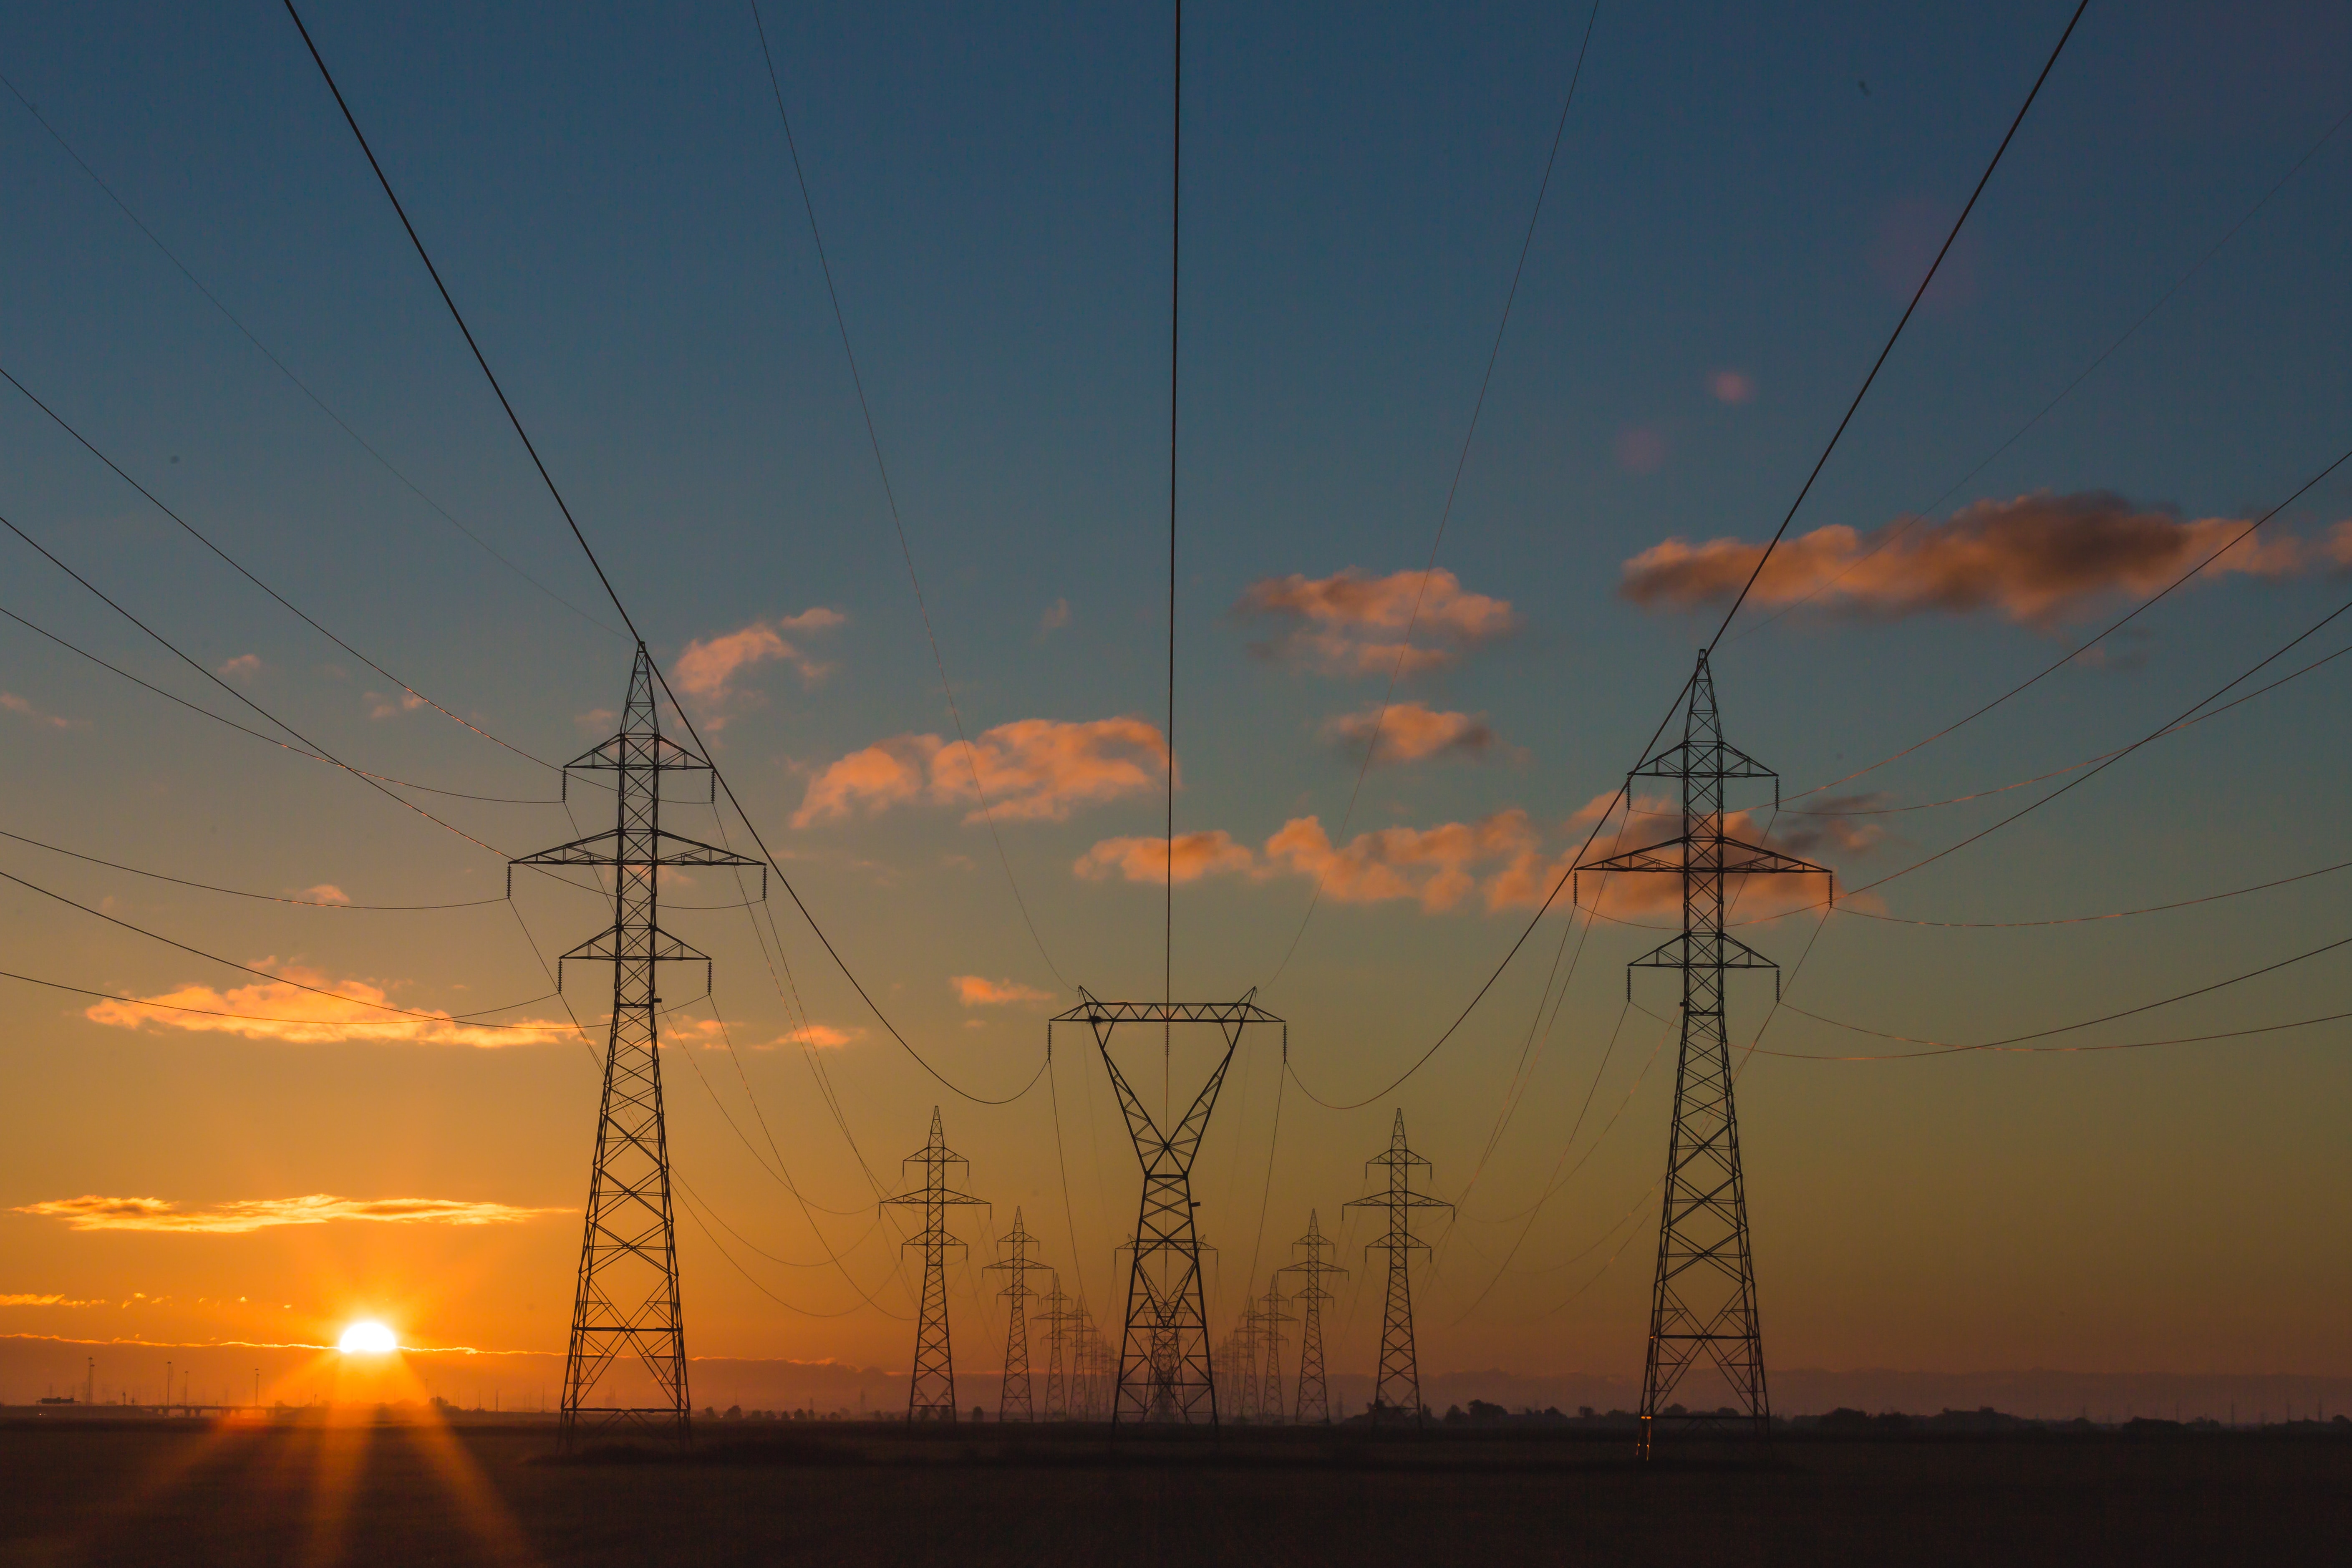
In the rapidly evolving energy infrastructure landscape, power line management presents unique challenges for utilities and grid operators worldwide. The intricate network of transmission and distribution lines that form the backbone of our electrical grid requires constant monitoring, maintenance, and documentation to ensure reliability and safety.
Try Flai
Power companies face increasing pressure to accurately map their assets, detect potential hazards, and streamline maintenance operations—all while managing utility infrastructure across vast geographical areas. Traditional manual inspection methods are time-consuming, expensive, and often prone to human error.
In this blog post, we’ll walk you through how the Flai solution can be used to classify and vectorize key components of power line infrastructure:
High-voltage conductors
Low-voltage conductors
High-voltage towers
Low-voltage towers
Insulators
Guy-Wires
Tension Wires
![]()
How It Works
Classifying a powerline point cloud is a relatively simple and streamlined process when using tools like FlaiNet. As shown in the figure below, the workflow typically begins with a Point cloud reader ** that ingests the raw LiDAR data. This is followed by the Classifier – Powerline component, which automatically segments the point cloud into key classes such as wires, towers, ground, vegetation, etc. using AI-based methods. Finally, the results are saved using a Point cloud writer.
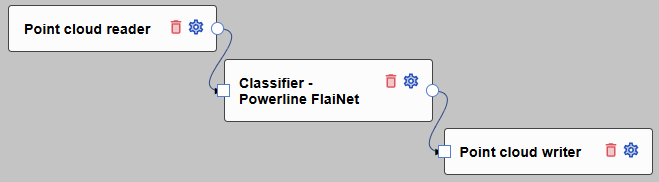
Illustration of the classification process in the Flai web app to label powerline point clouds.
If you want to enhance your point cloud data and generate a vector dataset, you can easily do that with Flai. It offers tools that convert 3D data into structured geospatial features ready for analysis or GIS use.
The whole process might look complex, but it's actually straightforward to use. To start of, it's best to use the "Power line template" - this will create all the necessary flow nodes that are required to take you from a raw point cloud to vectorized power line infrastructure information. Power line processing comprises of several steps that can be fine-tuned to the specifics of your dataset.
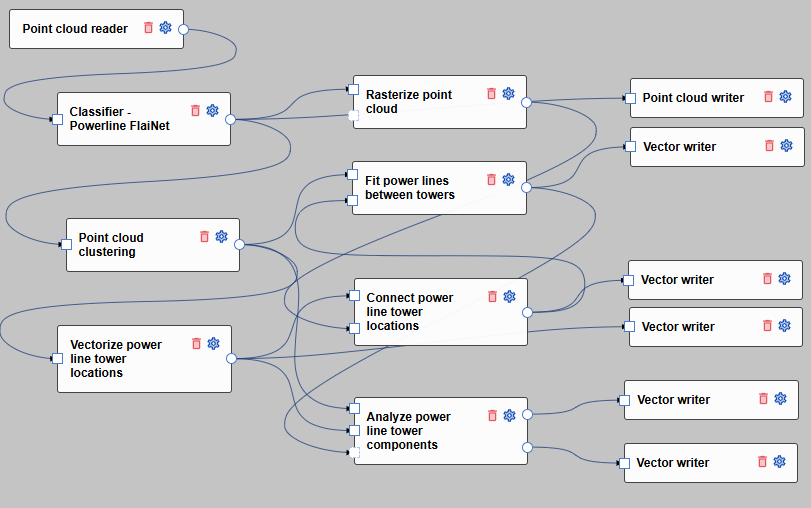
Illustration of the whole process in Flai webb app to obtain the classification and vectorisation of the point cloud for power lines.
This flow processes a point cloud of power lines by first reading the raw data and classifying it using the Power line FlaiNet model to identify key infrastructure elements.
It then clusters the classified points to better isolate features like towers and conductors. Tower locations are extracted and vectorized, followed by connecting and analyzing the structural components of each tower.
The points of the power lines are fit using a catenary string fitting algorithm and the connection points are snapped to the insulators.
The final outputs—vector data representing towers, lines, and components such as guy-wire, insulators and tension wires, along with the processed or rasterized point cloud—are written to various individual output files for further use or analysis.
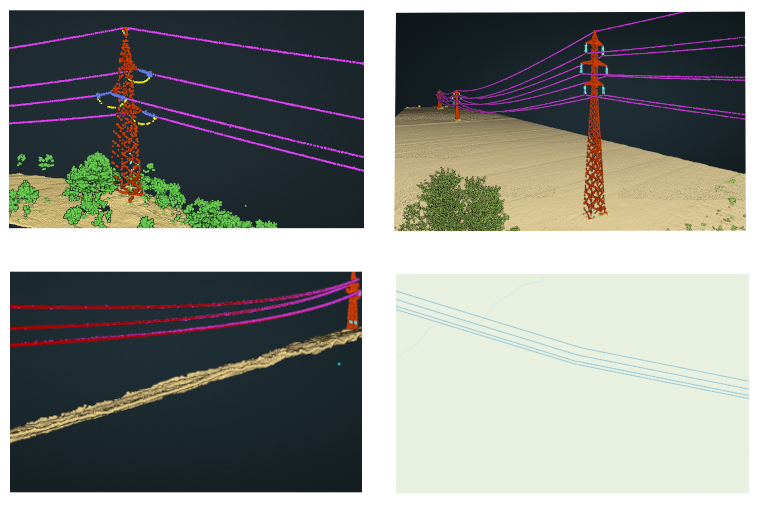
The image shows four different visualizations of powerline flow results. The top two images display point cloud classification. The bottom-left image shows linear wire vectors fitted to the classified point cloud representing the wires. The bottom-right image presents a 2D view of the wire vectors.
The process supports both simplicity and flexibility is designed to be simple but flexible. While most parameters are predefined for quick setup and efficient batch processing, users can adjust key settings—like clustering thresholds, raster resolution, or tower connection logic—to better fit their specific data. This balance between automation and customization makes the workflow suitable for both routine use and advanced analysis.
Analyze Power Lines Now
Results
The Flai solution allows users to classify point clouds of power line infrastructure into multiple predefined classes, enabling consistent and efficient interpretation of complex 3D data. In addition to on-the-fly classification, users can access both the classified point cloud and vectorized representations of the detected objects.
Classification classes
Powerline wires
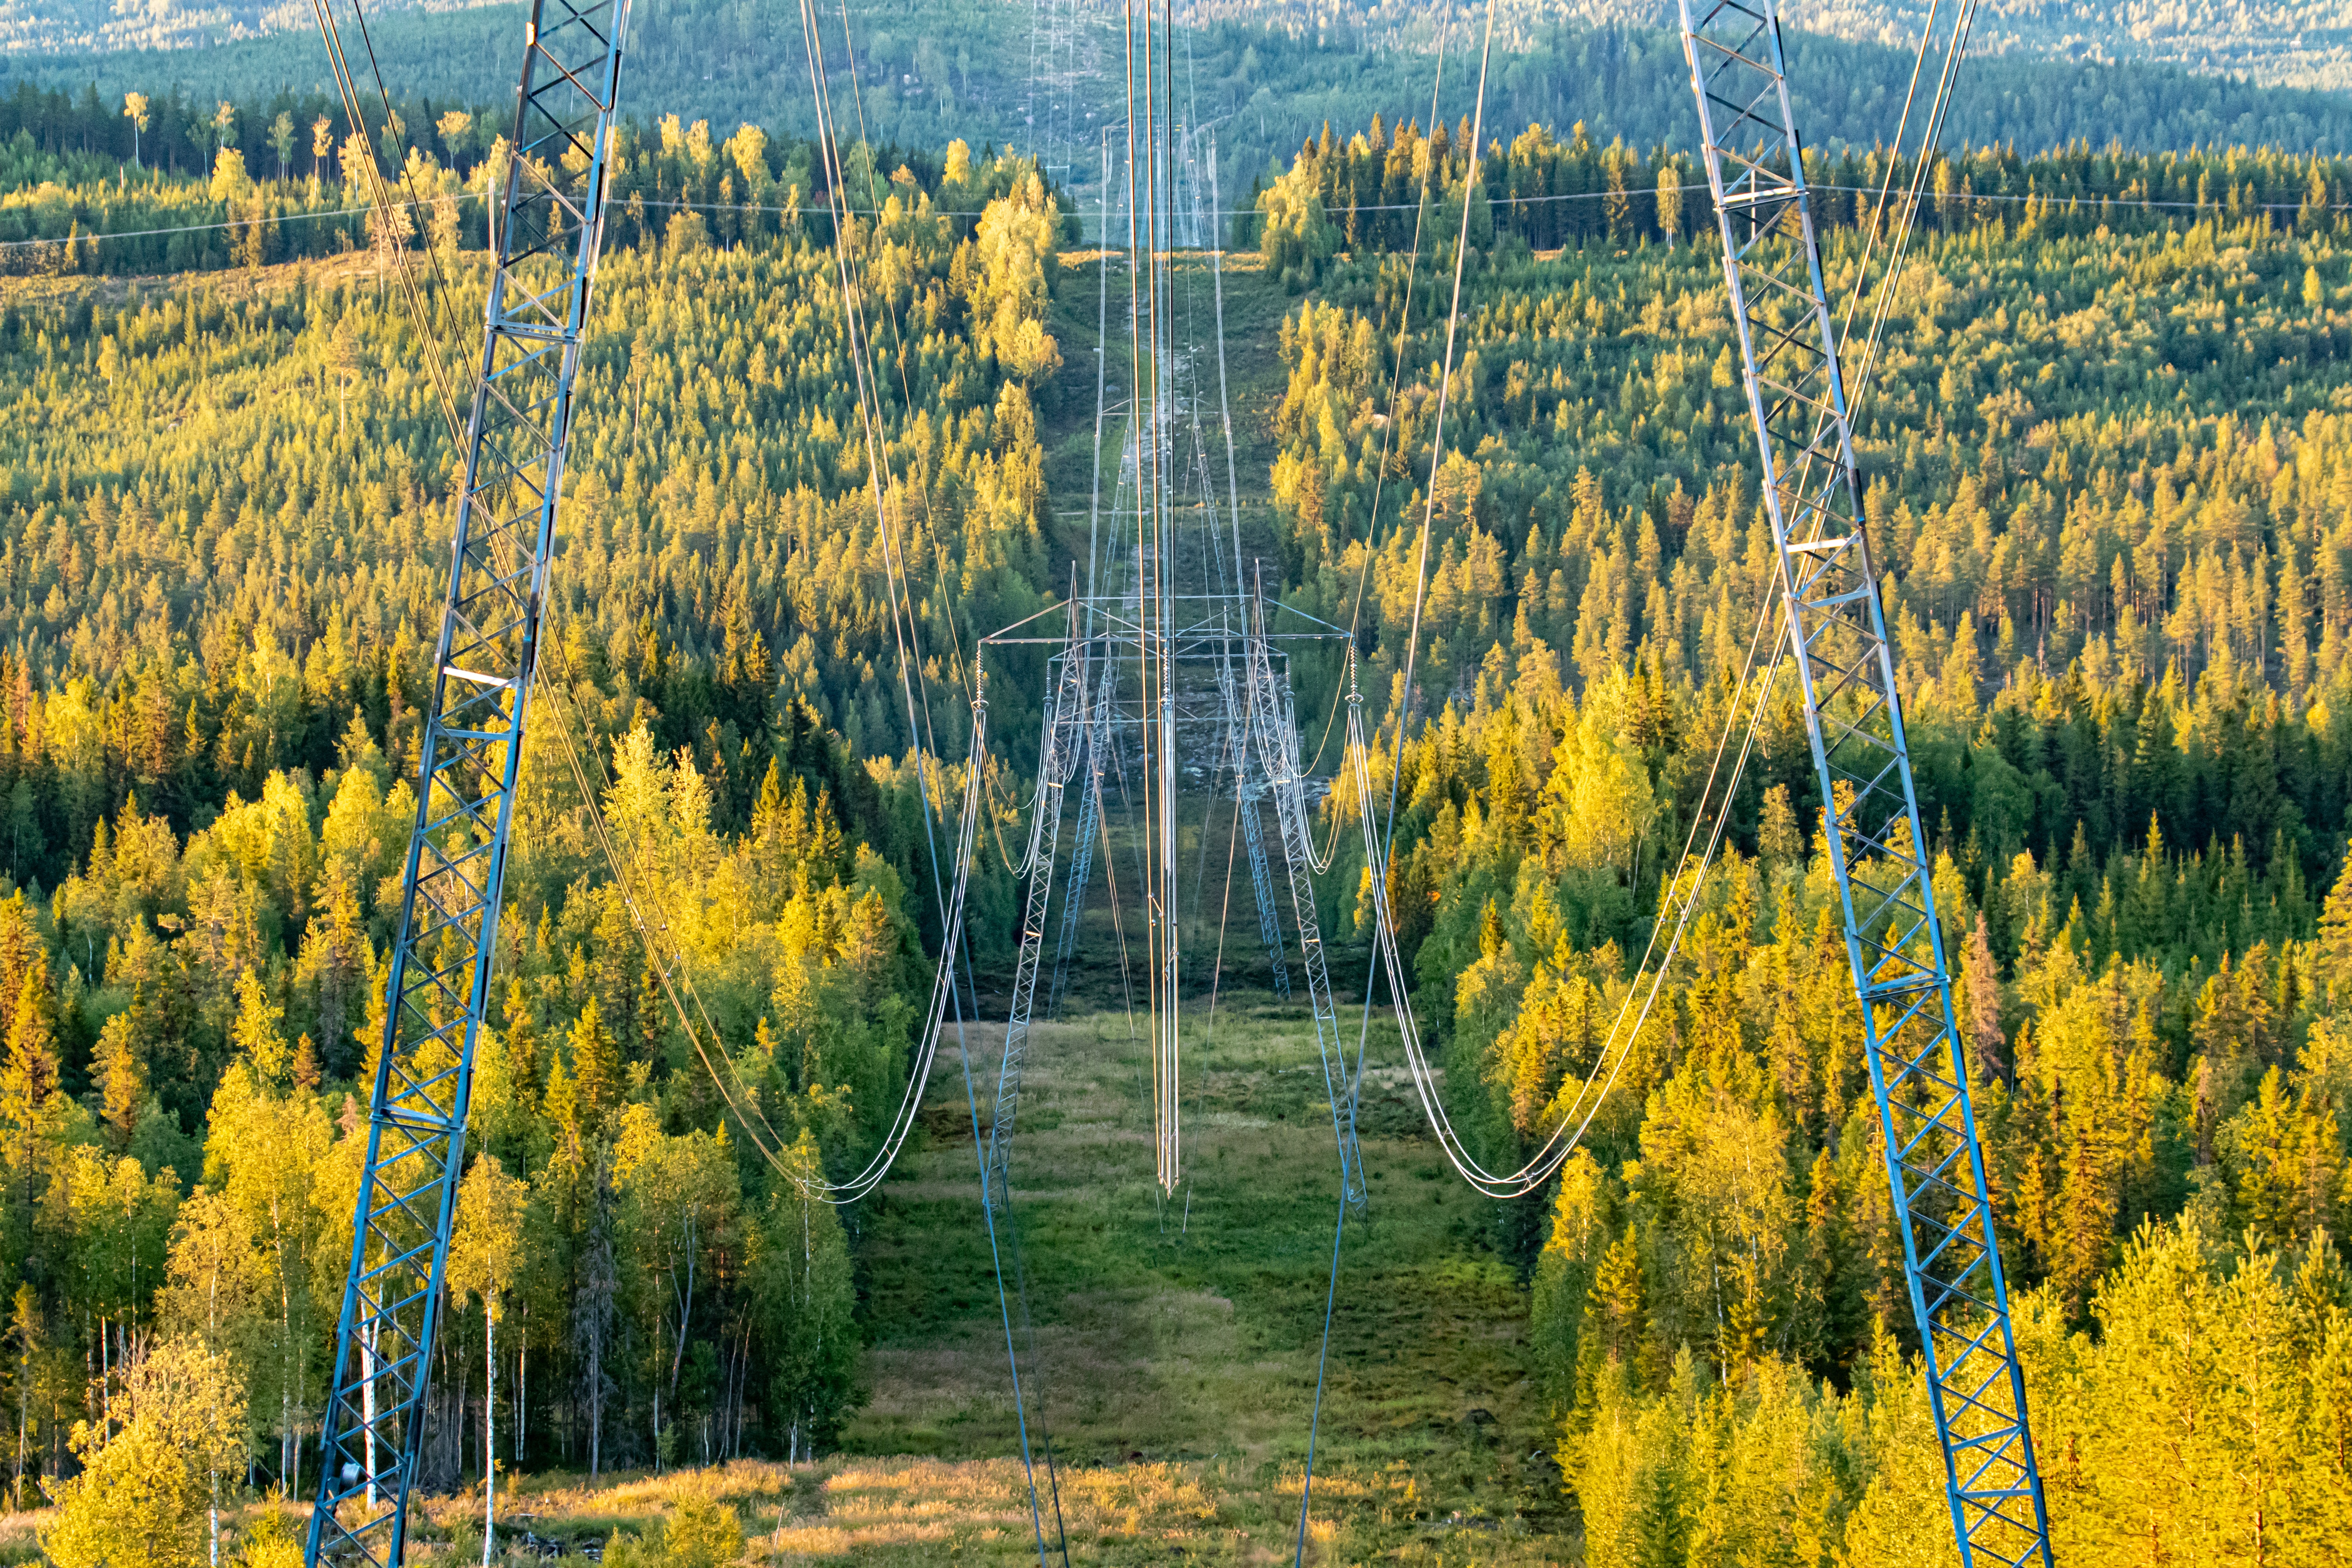
Power lines are essential components of the electrical grid, carrying electricity over long distances from power plants to homes. Made of thick aluminum or copper wires and suspended on tall towers, they enable reliable power distribution—but also pose safety risks despite their everyday presence.
Capturing power lines in point cloud data presents several challenges due to their physical and material characteristics. As thin, elongated structures, they offer a minimal surface area for LiDAR returns, and their dark coloration—often black or grey—reduces reflectivity.
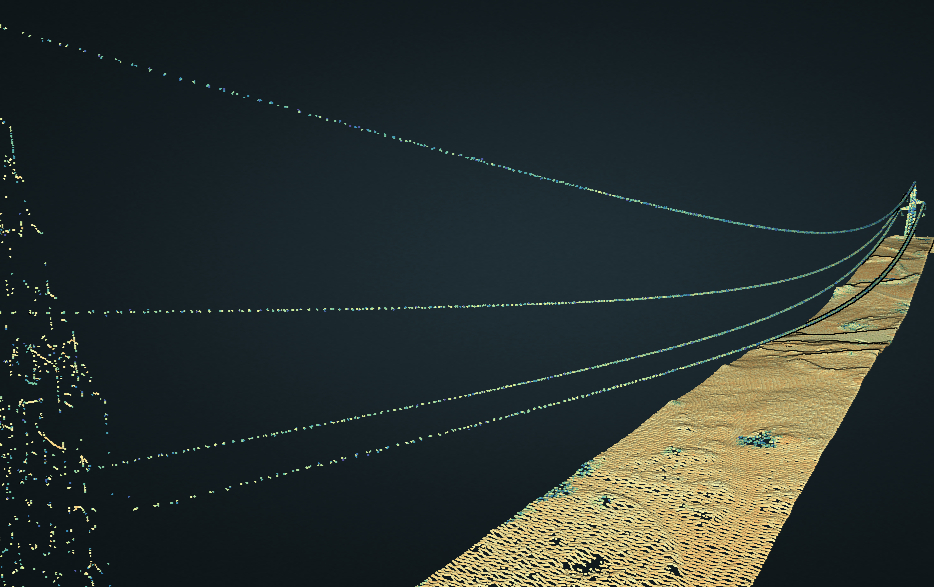
Airborne LiDAR point cloud of transmission line
It is important to point out that there are some differences between the different data collections, which affect the final results. Data captured by drones is generally noisier due to less stable flight and lighter sensors. This results in less continuous and more scattered points on power lines, unlike the smoother, denser captures from helicopters or airplanes with high-grade LiDAR systems.
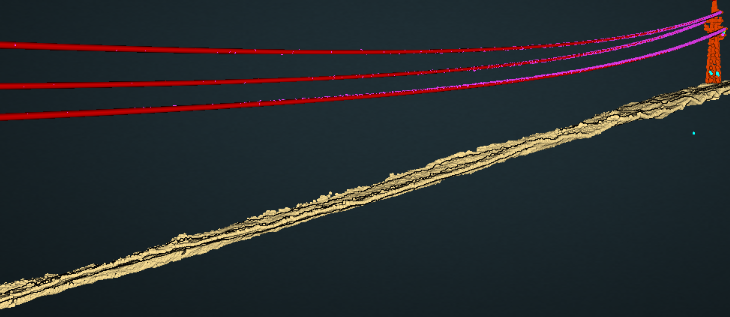
The FlaiNet power line classifier allows you to separate high and low voltage wires. Beyond classification, the process also enables extraction of 3D vector representations of individual conductors.
A classified point cloud using FlaiNet. The figure shows the high-voltage and low-voltage lines separately.
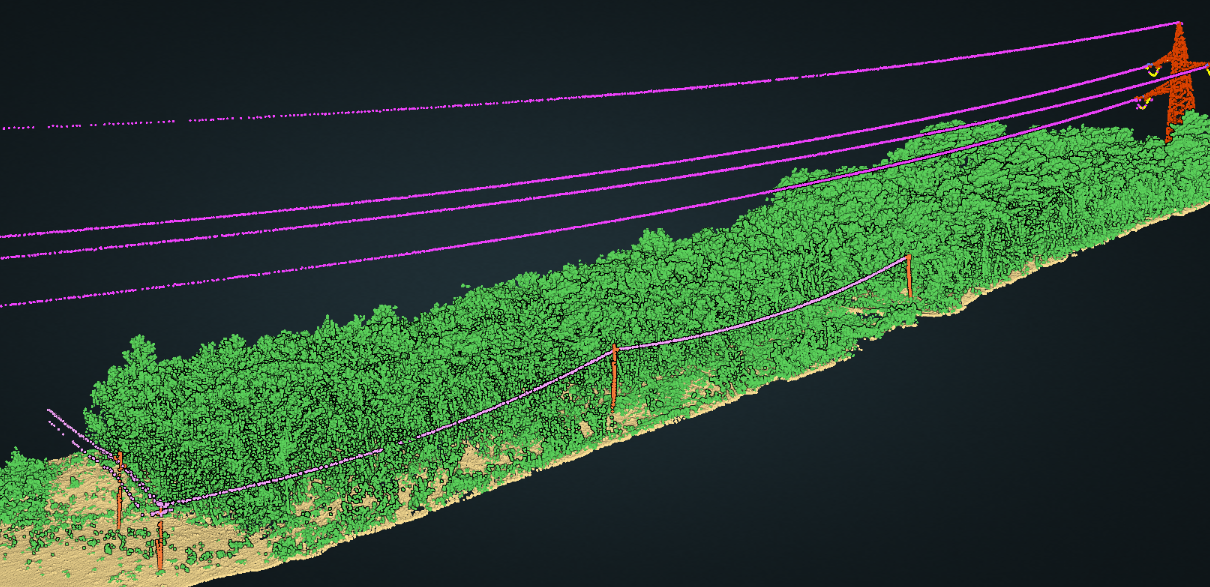
The classified point cloud is then used as a basis for further analysis. One of the final results is the vectors that are fitted to the point cloud.
A classified point cloud, enhanced with wire vectors.
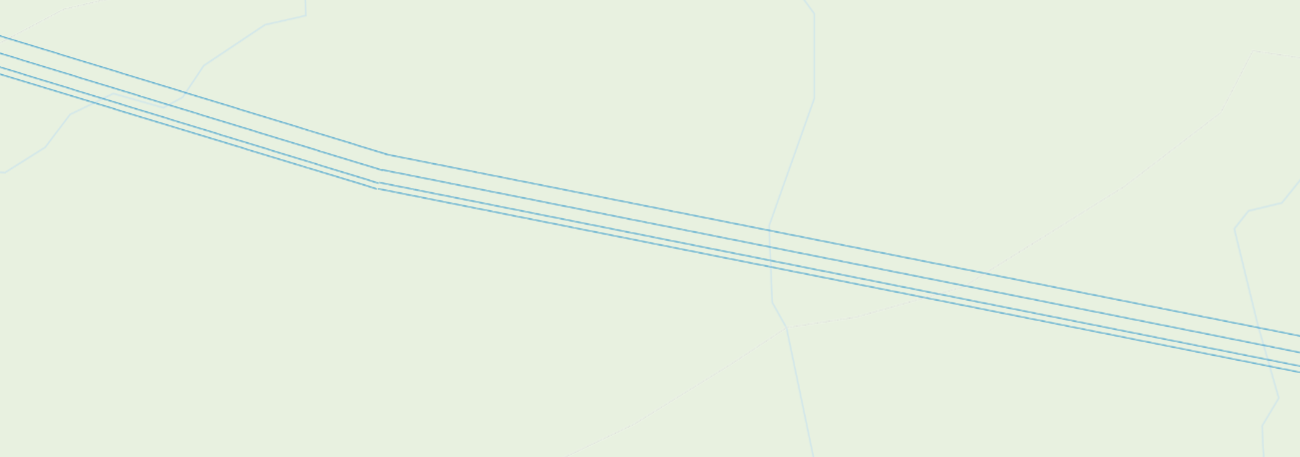
2D view of the vectors representing the powerline wires.
Powerline towers
![]()
Power line towers, also known as transmission towers, are tall structures designed to support voltage electrical conductors for power transmission across long distances. These towers are crucial components of the electrical grid, helping to deliver energy from power plants to substations and eventually to homes and businesses. They come in various designs—like lattice steel, tubular steel, or concrete poles—depending on the terrain, voltage level, and environmental conditions. Despite their utilitarian look, power line towers are engineering feats designed to withstand strong winds, ice, and the tension of heavy cables.
Power line towers come in various shapes and designs, making it essential to include a diverse range of examples in the training dataset. One of the most significant distinctions lies between high-voltage and low-voltage towers, as they differ not only in size but also in structure and purpose. Accurately representing both types in the learning set helps improve the model’s ability to generalize and recognize different kinds of towers across real-world scenarios.
Similar to how it differentiates between wires, the model is also capable of distinguishing between high-voltage and low-voltage power line towers. This distinction is crucial, as each type has unique structural characteristics that affect how they appear in different environments.
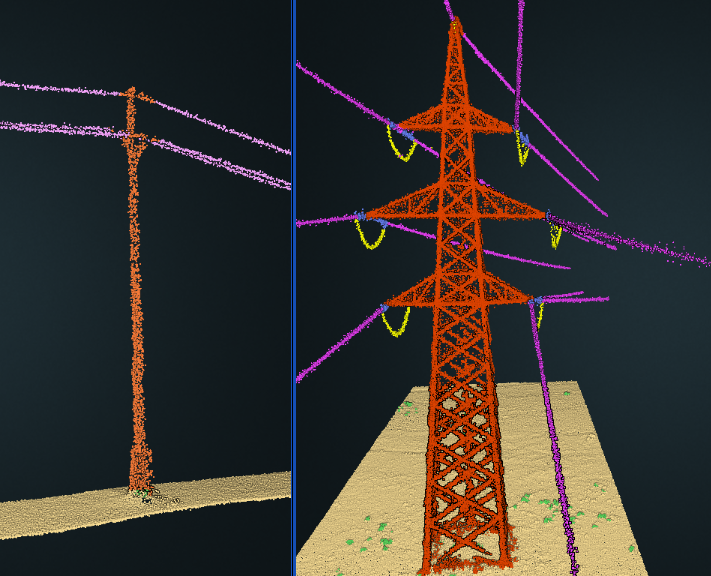
Showing a classified point cloud. The left image shows the point cloud of a low voltage tower. The right image shows a high-voltage object - high-voltage tower. The point cloud was acquired by a UAV.
Insulators
![]()
Power line insulators are crucial components that prevent electricity from flowing between conductors and towers. Made of porcelain, glass, or polymer materials, these bell or disc-shaped devices create a protective barrier that blocks electrical current while supporting the weight of transmission lines. Different types are used depending on voltage and conditions, helping keep the grid safe and efficient.
Insulators visualized in blue.
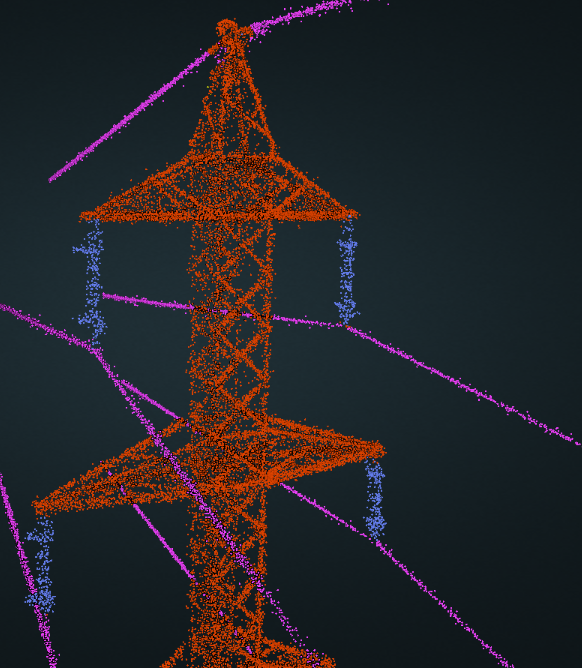
Insulators in blue on a slightly denser point cloud, captured with a UAV.
Insulators come in a variety of shapes, which makes it essential to include a wide range of examples in the training dataset. This diversity helps the model learn to recognize different geometries and improves its ability to generalize across real-world scenarios. Without sufficient variation, the model may struggle to correctly identify insulators that deviate from the most common forms.
Guy-wires
A tension cable is a tensioned cable used to stabilise structures such as utility poles in electricity infrastructure. It is anchored in the ground and attached to the pole at an angle to counteract lateral forces due to wind, uneven loads or the pull of power lines. Without the protective wires, taller or heavily loaded poles could lean or collapse. They do not carry electricity, but are essential to keep the structure upright and safe, especially in exposed or uneven terrain.
Tension wire
A tension wire, also known as a messenger wire, is used in power line infrastructure to support the weight of power lines between towers, preventing excessive sag while allowing for thermal expansion and contraction. By maintaining appropriate tension, they ensure safe distances between energized lines and the ground, buildings, and vegetation.
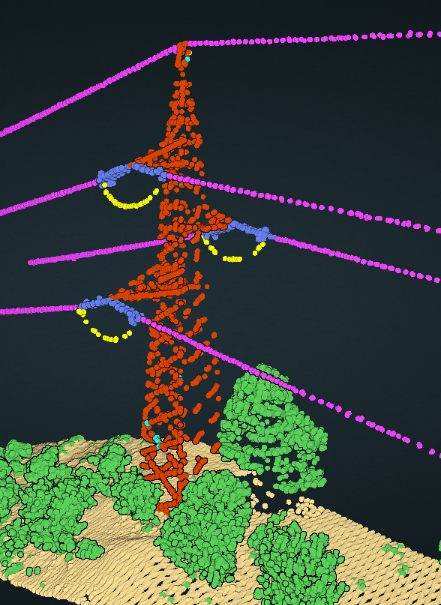
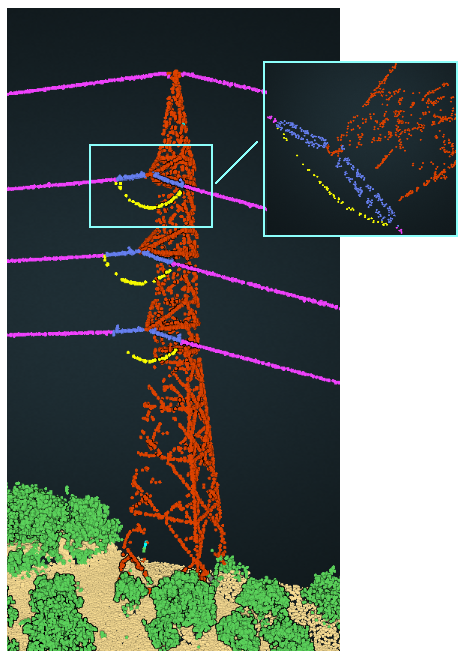
Full scene showing a utility pole with classified components; tension wires (yellow) extend from the structure to support overhead lines.
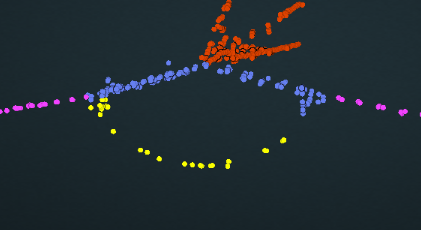
Isolated view of tension wires (yellow) in a 3D point cloud, highlighting their curved geometry and attachment points.
These two images show a 3D point cloud of tension wires on a utility pole. The tension wires are visualized in yellow extending from the wire structure, indicating their role in supporting and stabilizing the electrical lines.
Analyze Power Lines with Flai
With the launch of Power Line Classification and Vectorization in Flai, utilities and grid operators now have a powerful tool to streamline powerline asset management. By automating the detection and vectorization of components such as towers, conductors, insulators, guy-wires, and tension wires, this workflow enables faster, more accurate analysis of large-scale infrastructure. It reduces reliance on manual inspections, minimizes risk, and enhances planning for maintenance and upgrades. As power grids grow more complex and distributed, tools like this will play a key role in maintaining a resilient, efficient energy network.
Tags:
Recent Posts
How to Keep Original (Ground) Labels Unchanged When Using Flai Classification
Pushing the Boundaries of Situational Awareness at REPMUS 2025: Our AI-Driven REA Journey