- Apr 12, 2023
- 3 min read
Updated: Oct 4, 2023
Forestry inventory is a crucial aspect of sustainable forest management. It involves collecting data on the characteristics of a forest, such as height, diameter, age, and overall health. This information helps forest managers make informed decisions on timber harvesting, reforestation, conservation, and wildlife habitat management. Traditional forest management methods such as ground-based surveys are time-consuming and expensive. More modern technologies like LiDAR allow us to capture point clouds of large areas, but the challenge remains how to gain insights from the data. In this blog post, we will show how the Flai web app can be used to automatically obtain three important vector products from LiDAR point clouds: tree trunks, tree top locations, and canopy shapes and structures.
Single tree forest inventory
The starting point for our forestry vector production pipeline is a classified point cloud that includes class labels for ground, tree trunk, and other vegetation. To classify your point cloud, you can use the Flai Forestry classifier. To get familiar with the basics of how to run a processing flow, make sure to read our blog post about how to run a classifier on Flai web app. Forestry classification flow is a simple processing flow comprised of a reader, forestry classifier, and writer.

Basic Flai forestry classification flow.
After you obtain a classified point cloud, you can start building a forestry product pipeline. First, create the ground and vegetation rasters. To rasterize a point cloud, you can use the “Rasterize point cloud” flow node. It takes a classified point cloud as input and outputs a raster. To set the resolution and select which classes we want to rasterize, click on the gear icon of the flow-node and set the resolution to 1 and pdal filter to “Classification[2:2]”(assuming that ground is represented by classification label 2). Other options can be left as default. This flow-node will rasterize ground z values. For the vegetation raster, you must configure the appropriate classification label and select “maximum” as the method used to compute pixel values. For best results using slightly higher raster resolution, we found 0.25-0.5 to be values that provide the best results. After rasterization, it is recommended to interpolate raster pixels where there is no data. To do this, you can use flow nodes “Interpolate no data pixels” and “Fill pits in elevation model”.You are now ready to launch our treetop and tree trunk detection algorithms.
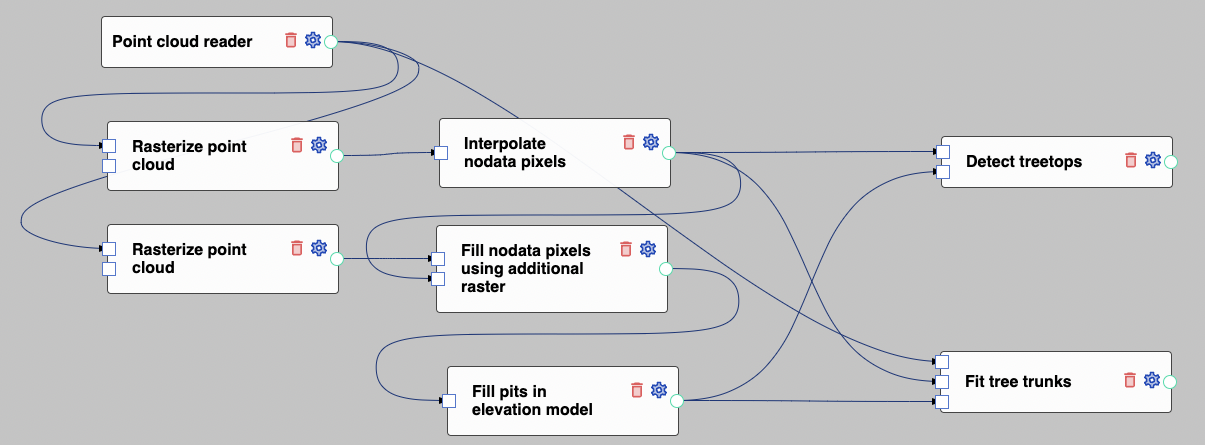
Processing flow that generates treetop and tree trunk vector products.
The treetop detection flow node takes the terrain elevation model and vegetation elevation models as inputs. There are a few possible parameters that depend on the type of forest you want to detect, but usually leaving them as default is good enough.
The tree trunk detection flow node takes 3 inputs: an annotated point cloud, a vegetation elevation model, and a terrain elevation model. To configure trunk detection, you have to input the label number of the tree trunk class in the point cloud. If your point cloud is dense enough so that tree trunk diameters can be measured, you can enable tree trunk diameter extraction. This measures the diameter at breast height (DBH).
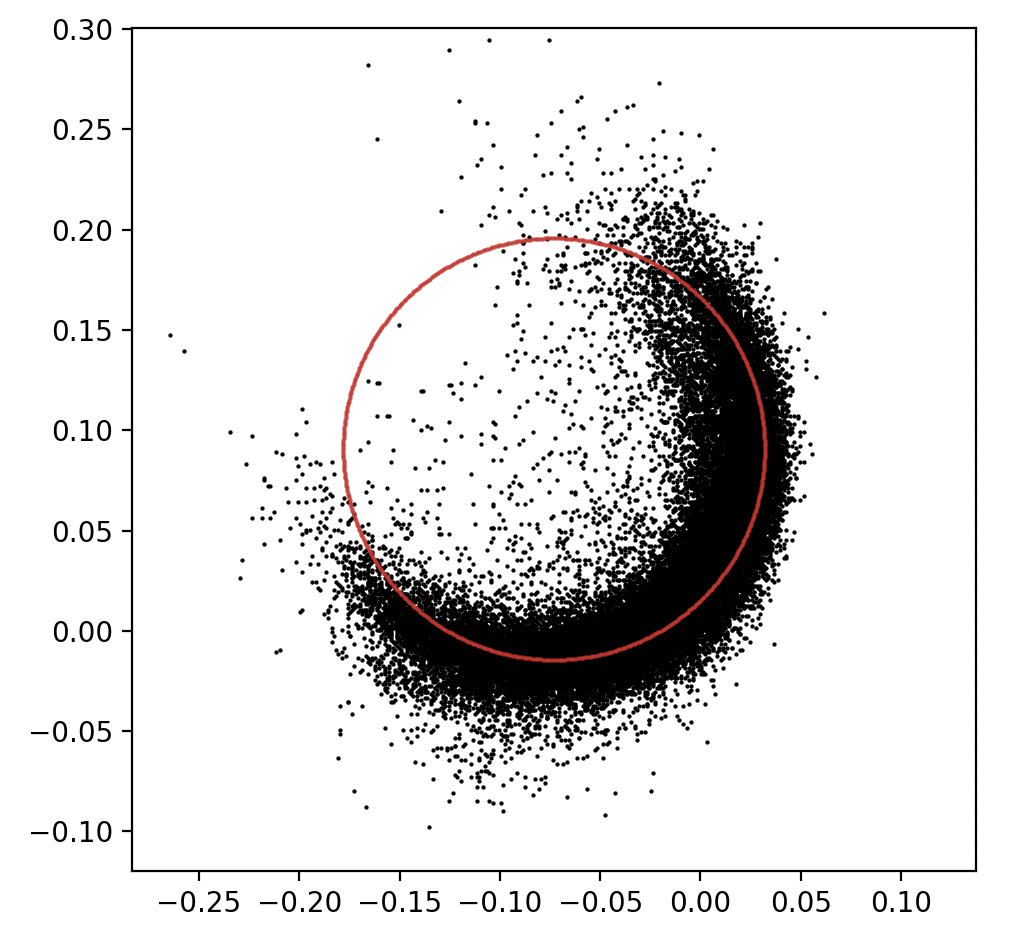
Example of DBH extraction from a dense point cloud
Lastly, we want to include the canopy segmentation flow-node. It takes 4 inputs: the same terrain and vegetation rasters as previous flow nodes, the annotated point cloud (optional input only if you need to know vegetation point distribution inside a canopy), and treetop locations from the previous node. To save all 3 vector layers you need3 vector writers. The final vector layers can be viewed in the Flai web app or downloaded from the catalog and inspected externally.
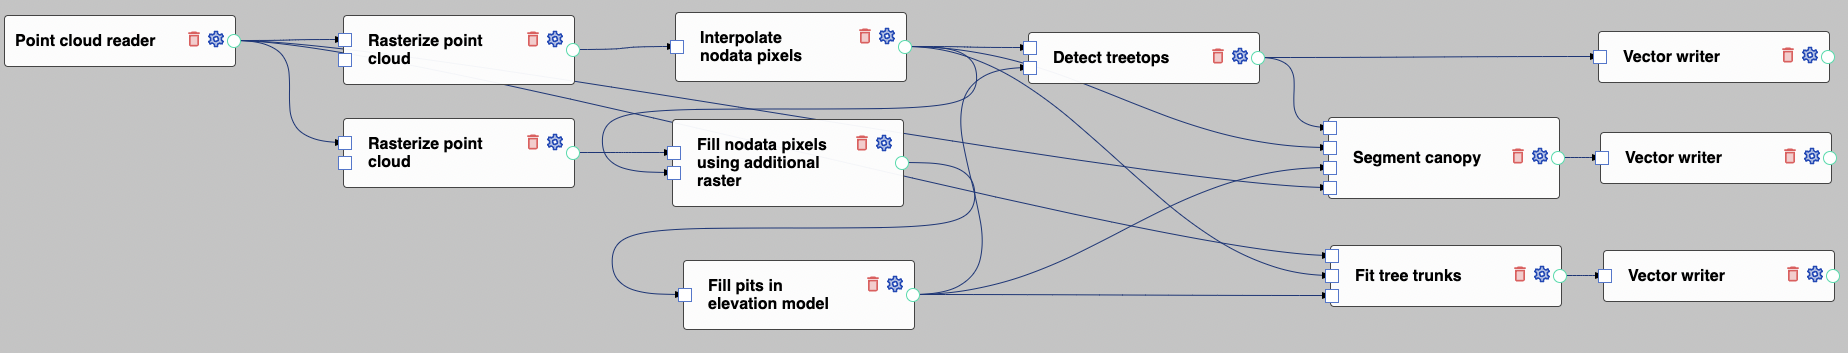
Final tree inventory vector product flow
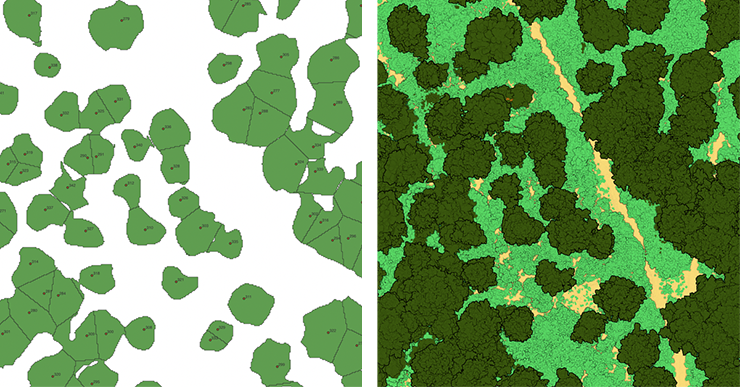
Classified point cloud (left) and generated canopy shapes (right)
These vector products offer valuable benefits for forestry and forest inventory management. The treetop coordinates provide valuable information on tree density, enabling organizations to monitor forest health and plan for timber harvesting. Tree trunk vectors and DBH offer insights into a tree's structure and growth patterns, as well as help estimates biomass and carbon stock. Lastly, the canopy shapes facilitate accurate mapping of tree crowns, allowing for precise forest inventory management and helping to identify areas that require intervention or conservation efforts. To see how Umweltdata GmbH has used our vector products to automatically extract parameters for more than 170000 trees, make sure to read our forestry use case blog post.
In summary, Flai's automated point cloud processing pipeline is changing how forestry and forest inventory management is handled. By producing tree top locations, tree trunk directions, and canopy shapes from point clouds, our technology offers useful products automatically that help organizations make smart choices and manage their forests effectively.
For more information about our products and inquiries regarding potential new features, you can reach us at info@flai.ai. We are always ready to answer any question.
Try our platform
Tags:
Recent Posts
How to Keep Original (Ground) Labels Unchanged When Using Flai Classification
Pushing the Boundaries of Situational Awareness at REPMUS 2025: Our AI-Driven REA Journey